
Oil: Recovery Without Normalization
Depleted inventories, disrupted shipping and a tightening prompt curve underpin the case for higher oil prices.
Last Monday, I shared an oil long setup on X. The move delivered almost 7% into Friday, when I closed the long ahead of the weekend. Today is Saturday, 17 October. I’m reviewing the week to form a view for the next one, and decided to turn that work into this newsletter.
I remain bullish oil. Inventories are still being depleted, shipping remains exposed to repeated attacks, and the premium for prompt crude is widening. Price has also built a constructive base across time frames.
In July’s oil thesis, I took bearish exposure through put spreads because I expected the geopolitical premium to compress. The physical market was tight then, too. By August’s update, oil had fallen sharply and I had realised my profits. A ceasefire headline can remove a premium much faster than inventories and commercial confidence recover.
Inventories are still falling
September Gulf crude exports reached 13.9 million barrels per day, more than three-quarters of their pre-war level, according to the IEA. Total oil flows through Hormuz recovered to 10.9 million barrels per day, while exports through bypass routes reached 5.6 million.1
Despite that recovery, global inventories fell another 10 million barrels. The composition was more concerning than the headline: on-land stocks fell 113 million barrels, while oil on water increased 103 million. By the end of September, observed stocks were 509 million barrels below end-February, and on-land inventories were at their lowest since at least 2016.1
The increase in oil afloat should help replenish receiving markets as cargoes arrive. Until deliveries exceed consumption, however, depleted storage leaves less room to absorb delayed cargoes or another supply interruption.
The EIA’s October outlook projects further global withdrawals of approximately 0.67 million barrels per day in October, 0.47 million in November and 0.93 million in December, before switching to a substantial build in January.2 The forecast recovery is the principal medium-term challenge to a long position. For the fourth quarter, it still leaves consumption drawing on inventories.
Emergency releases offer nearer-term relief. Reuters reported a further fuel release of more than 20 million barrels and a US request for an exchange of up to 17 million barrels from the SPR.3 These supplies can ease immediate shortages while commercial deliveries recover, at the cost of drawing further on reserves.
Hormuz remains disrupted
UKMTO’s overview dated 16 October lists twelve regional attacks, ten in Hormuz, with the listed events occurring on 9–13 October. It also warns that non-reporting prevents a complete tally.4 The attacks threaten the reliability of the export recovery just as consuming markets need sustained deliveries to rebuild stocks.
JMIC reports that GFS PRIDE was struck on 13 October, caught fire and sank on 14 October, leaving floating containers. The same report lists the tanker EVER VICT as not under command after an 11 October strike.5
My optical imagery from 14 October, 06:48 UTC, shows a cluster of small coloured objects near the reported GFS PRIDE loss area, not apparent there on 9 October. Possible floating debris is consistent with the reported container loss, although the objects remain unidentified.
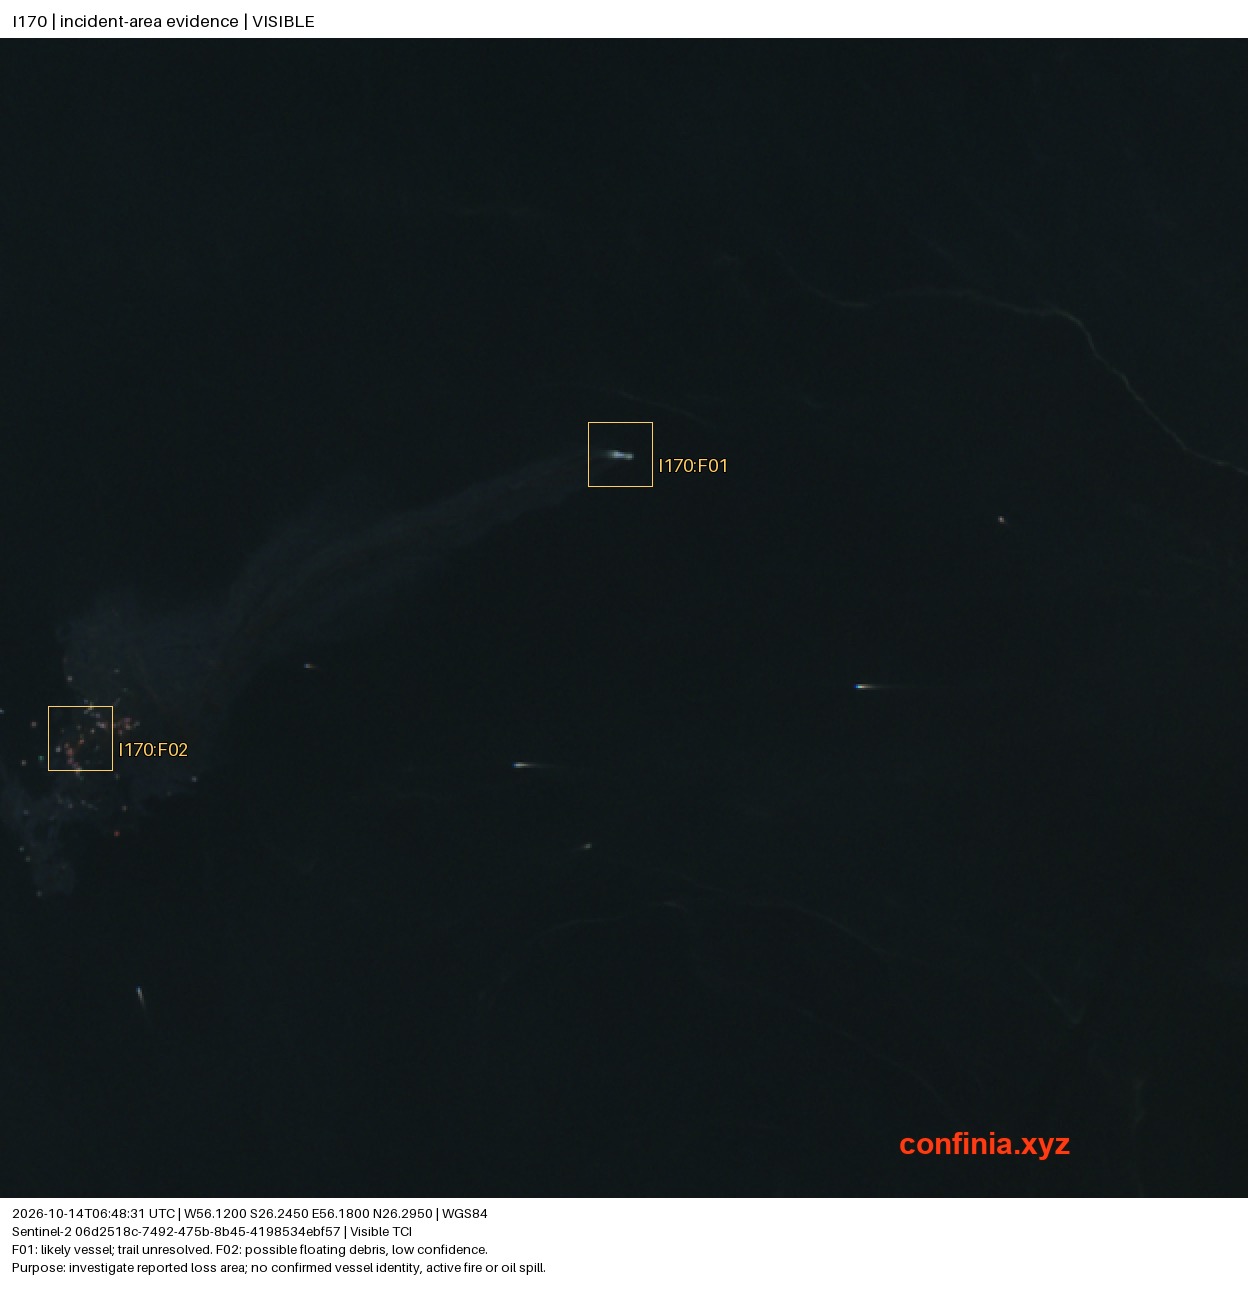 14 October, 06:48 UTC. F02: possible floating debris, low confidence. F01: vessel-shaped object with an unresolved trail. Contains modified Copernicus Sentinel data (2026).
My Sentinel-1 observations on 15–16 October show likely vessels in the Oman-facing approaches, Iran-facing waters, western Gulf and Kharg surroundings. Commerce continues across these waters under persistent disruption.
 Sentinel-1, 15–16 October: likely vessel returns around Kharg, the western Gulf and both approaches to Hormuz. Acquisition times and coordinates appear in each panel. Contains modified Copernicus Sentinel data (2026).
Saudi Gulf terminals still depend on passage through Hormuz; Yanbu provides an outlet on the Red Sea. My 15 October optical observations show a large hull alongside Ras Tanura’s Sea Islands and several large hulls in Ju’aymah’s offshore mooring field. Saudi export infrastructure remains active on both coasts, with different exposure to interruption.
Saudi Arabia’s alternative outlet
At Yanbu, Sentinel-2 imagery from 15 October, 07:59 UTC, shows seven large hulls alongside the crude jetties: four North and three South.6
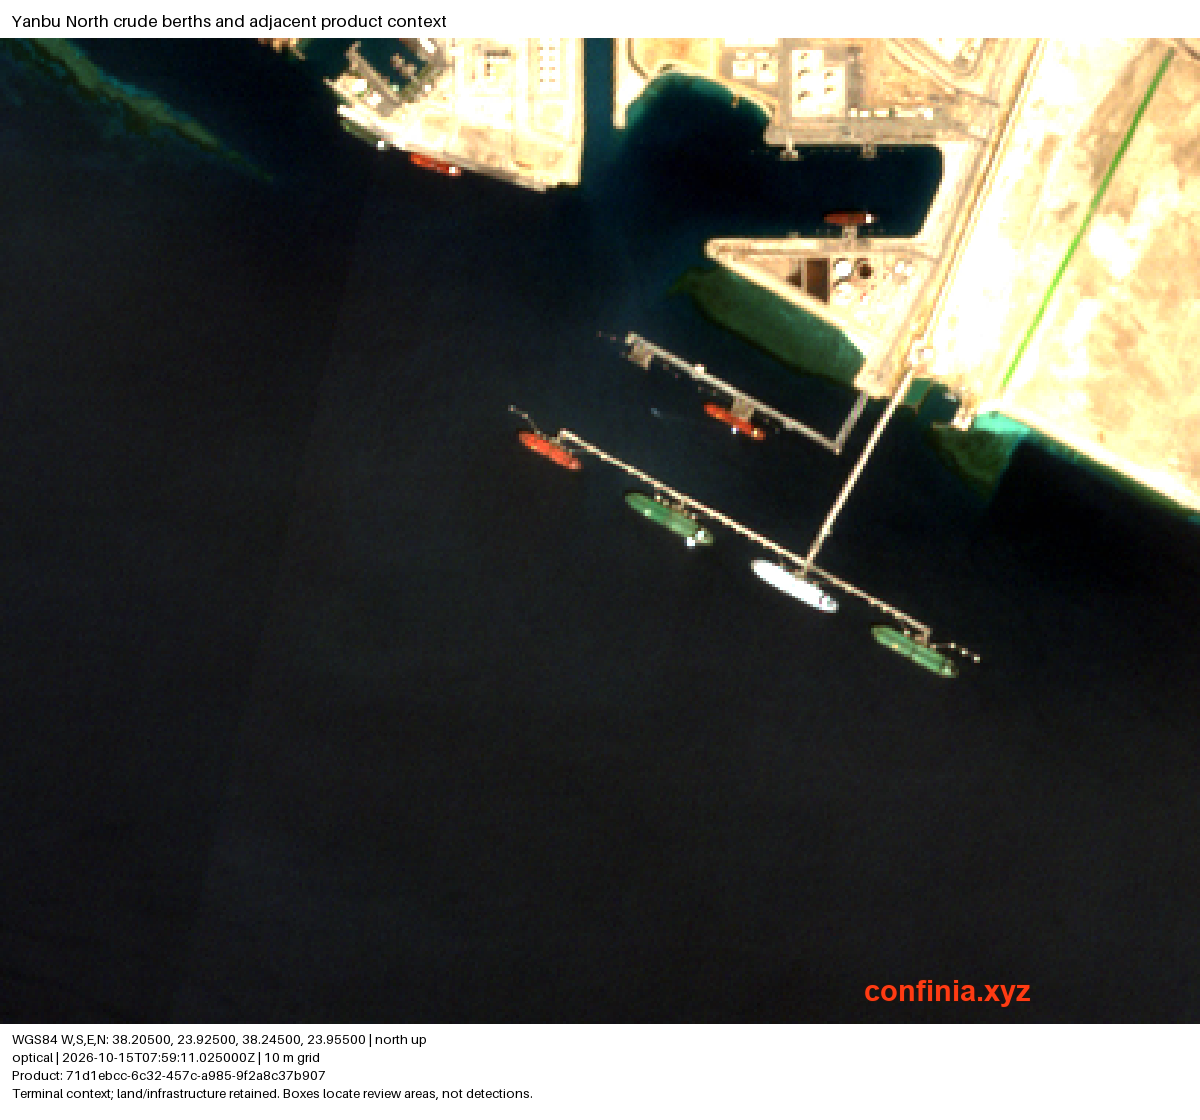 Yanbu North, 15 October 2026, 07:59 UTC. Four hulls alongside the crude jetty; the separate upper product berth is excluded. Contains modified Copernicus Sentinel data (2026).
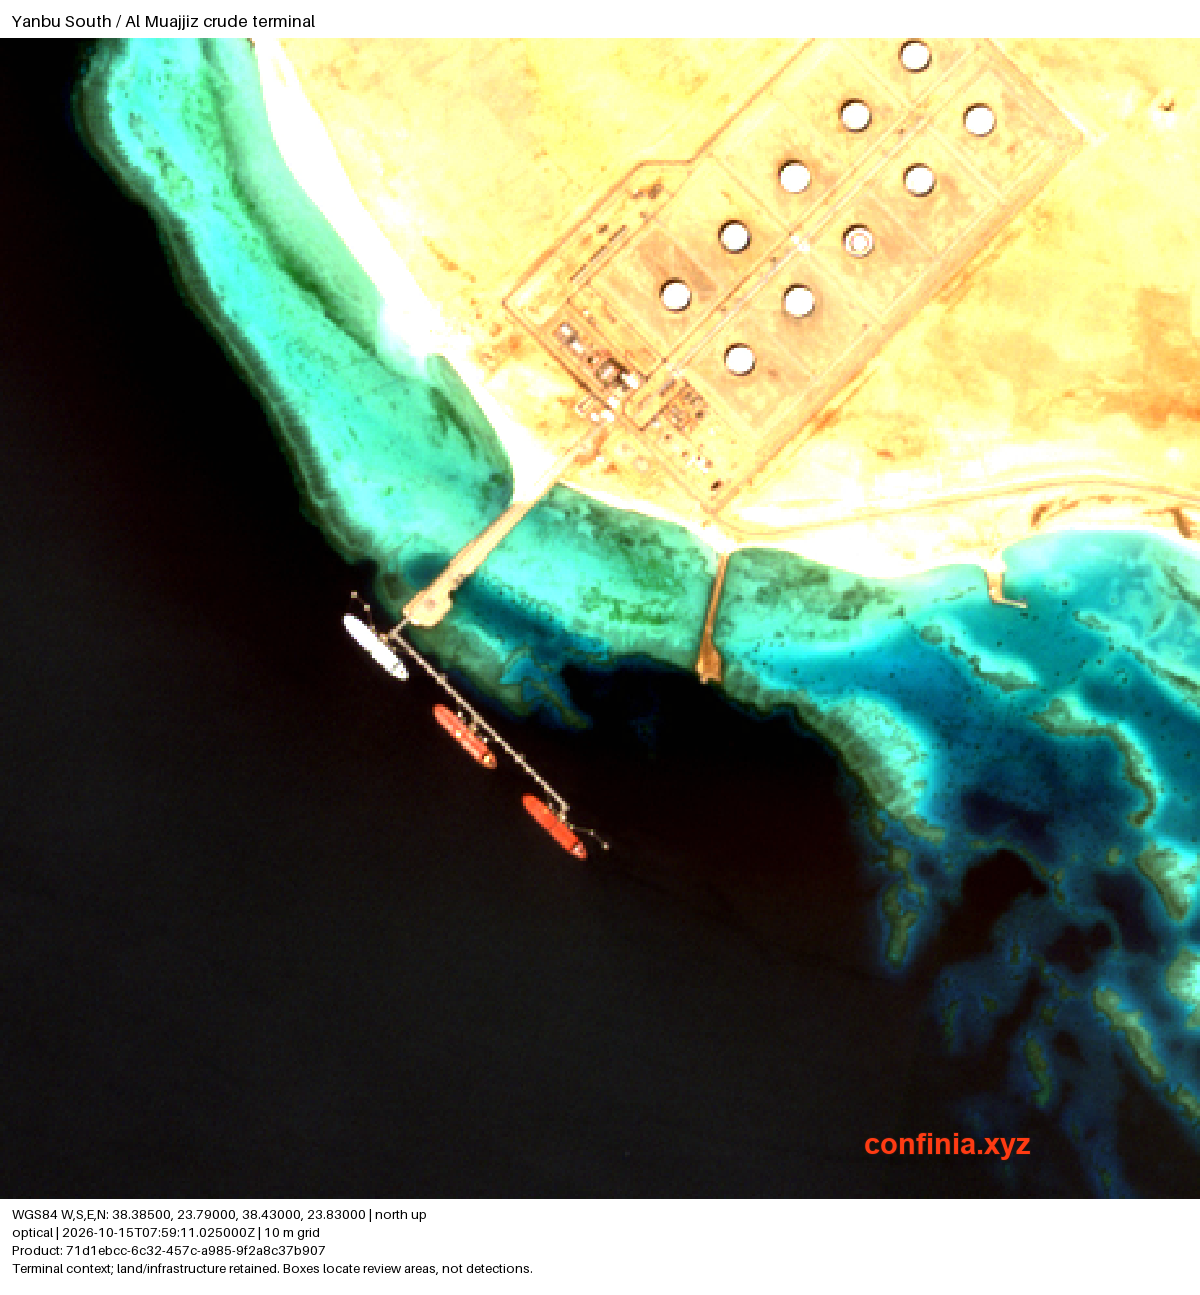 Yanbu South / Al Muajjiz, 15 October 2026, 07:59 UTC. Three hulls alongside the crude loading structure. Contains modified Copernicus Sentinel data (2026).
The available October observations show an uneven sequence:
| Acquisition UTC | North | South | Total |
|---|---|---|---|
| 5 October, 07:58 | 2 | 2 | 4 |
| 10 October, 07:58 | 2 | 0 | 2 |
| 15 October, 07:59 | 4 | 3 | 7 |
The latest scene is the busiest of the three, supporting continued use of the bypass. These berth counts measure occupancy; sustained export growth requires a longer flow series.6
Yanbu helps Saudi Arabia reduce its dependence on Hormuz, but the Red Sea route is also exposed. Reuters reported on Friday that a Saudi-led coalition intercepted a missile directed toward Yanbu, with initial reports indicating no infrastructure damage.3 Reliable exports require both operating terminals and dependable passage beyond them.
Prompt crude is tightening
The US stock data show further depletion. For the week ending 9 October, commercial crude inventories fell 8.557 million barrels and distillate stocks fell 2.527 million.7
| US petroleum measure | Week ending 9 October |
|---|---|
| Commercial crude, excluding the SPR | 415.577 million barrels |
| Distillate stocks | 102.611 million barrels |
| Refinery crude inputs | 16.615 million barrels/day |
Hurricane production shut-ins contributed to the crude draw, according to Reuters.3 Stock behaviour as production returns will help distinguish temporary weather pressure from persistent tightness.
Friday’s curve already shows a stronger premium for immediate supply:
| WTI spread | 16 October |
|---|---|
| November–December | +$2.39/barrel |
| November–June | +$12.84/barrel |
November–December widened 92 cents from Thursday’s +$1.47.8 Prompt crude outperformed deferred delivery. For a bullish near-term trade, that strengthening backwardation is more persuasive than the outright price increase alone.
November NY Harbor ULSD also closed at a large premium to crude: its simple futures spread over WTI was approximately $104.35 per barrel.8 The incentive to produce more fuel is substantial, although freight, feedstock costs and operating capacity determine how much supply can respond. As in August, product scarcity alone would be insufficient grounds for a crude long. The current combination includes crude stock draws and strengthening backwardation.
CFTC futures-only data for 13 October show WTI managed-money net length of 40,574 contracts, down 13,024 on the week and around the 4th percentile of observations since January 2016.9 Speculative length was modest entering the latter part of the rally; Friday’s buying will appear in a later report.
Higher prices, weaker demand
The IEA forecasts a 2.6 million barrel-per-day contraction in global oil demand in 2026, yet still expects a deficit through year-end.1 Supply losses remain large enough to outweigh substantial demand destruction in that forecast.
US data show the economic pressure. September CPI rose 0.6% month over month and 3.7% year over year. Gasoline prices increased 9.1% in the month, accounting for more than half the headline rise. Core inflation was 0.3% monthly and 2.6% annually.10 Payroll growth was only 29,000, with unemployment at 4.2%.11
Higher fuel costs squeeze household purchasing power and business margins while complicating monetary easing. This weakens consumption and ultimately limits how far oil can rise. The bullish case depends on supply constraints keeping the near-term balance in deficit; a sharper contraction in consumption would erode it.
Price is positioned to challenge the highs
Crude sits above its 50-, 200- and 300-day simple moving averages. The recent consolidation formed a base around and above the upper boundary of yearly VWAP value, followed by a strong expansion higher. That combination is constructive for a challenge of the yearly highs.
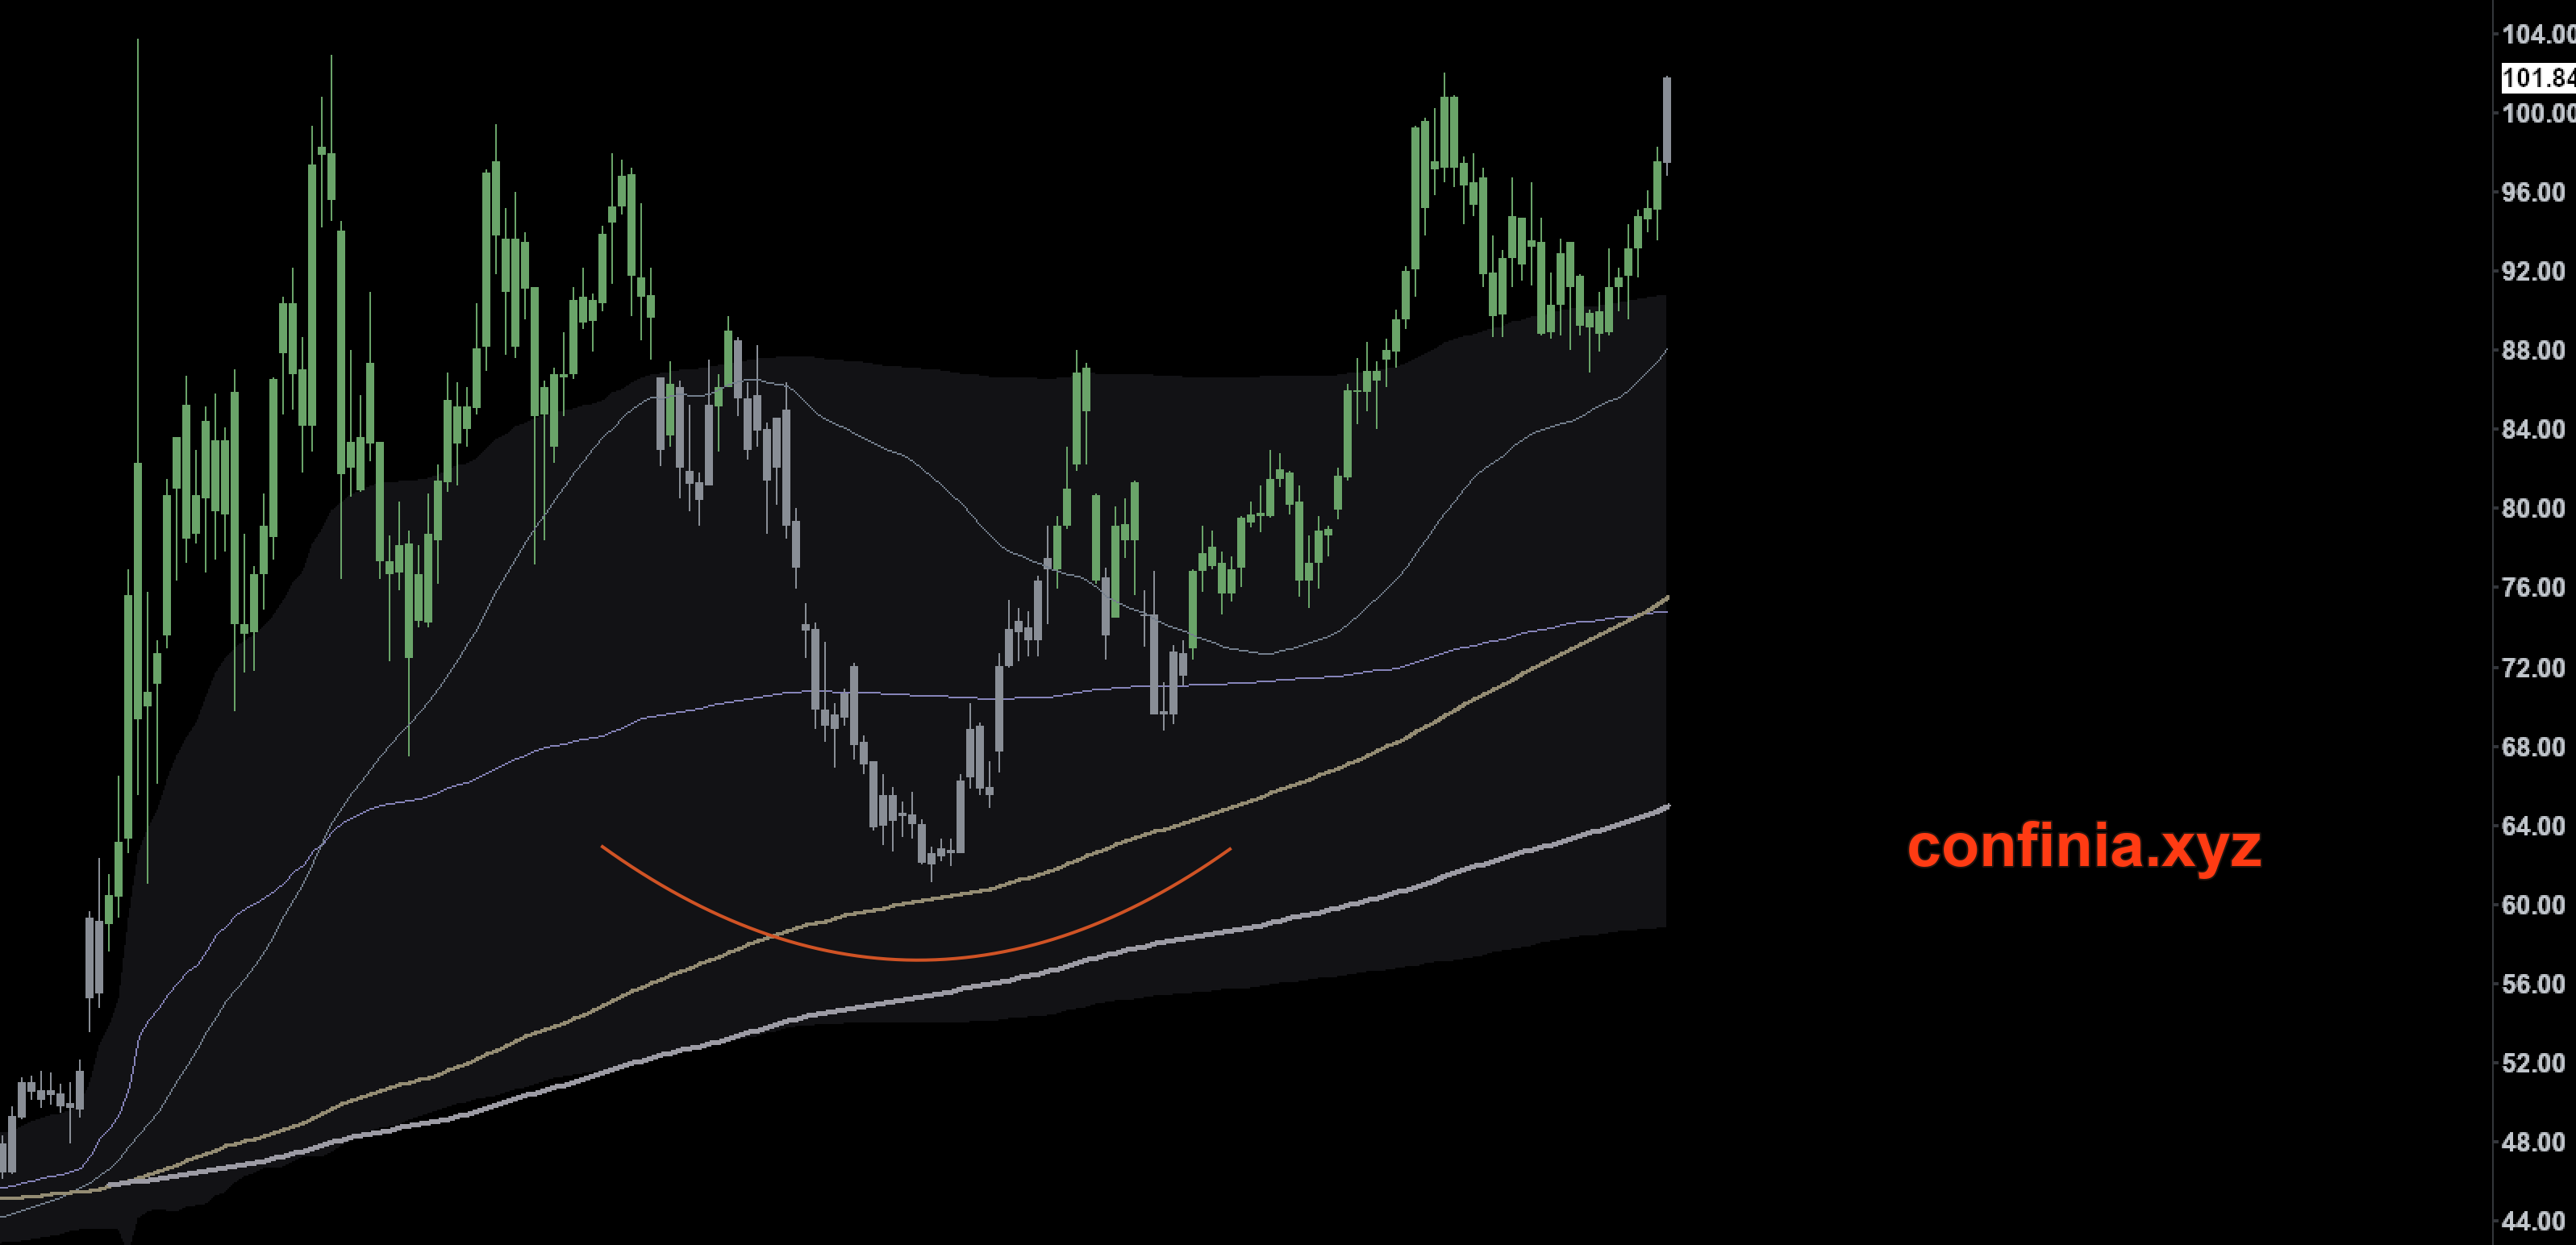 Daily CL through 16 October: 50-, 200- and 300-day SMAs, with yearly VWAP value. The prior yearly high is the next major upside test.
The session TPO profiles show the intervening upside references cleared and a well-developed base beneath the advance. Friday extended rapidly through the upper part of the recent range.
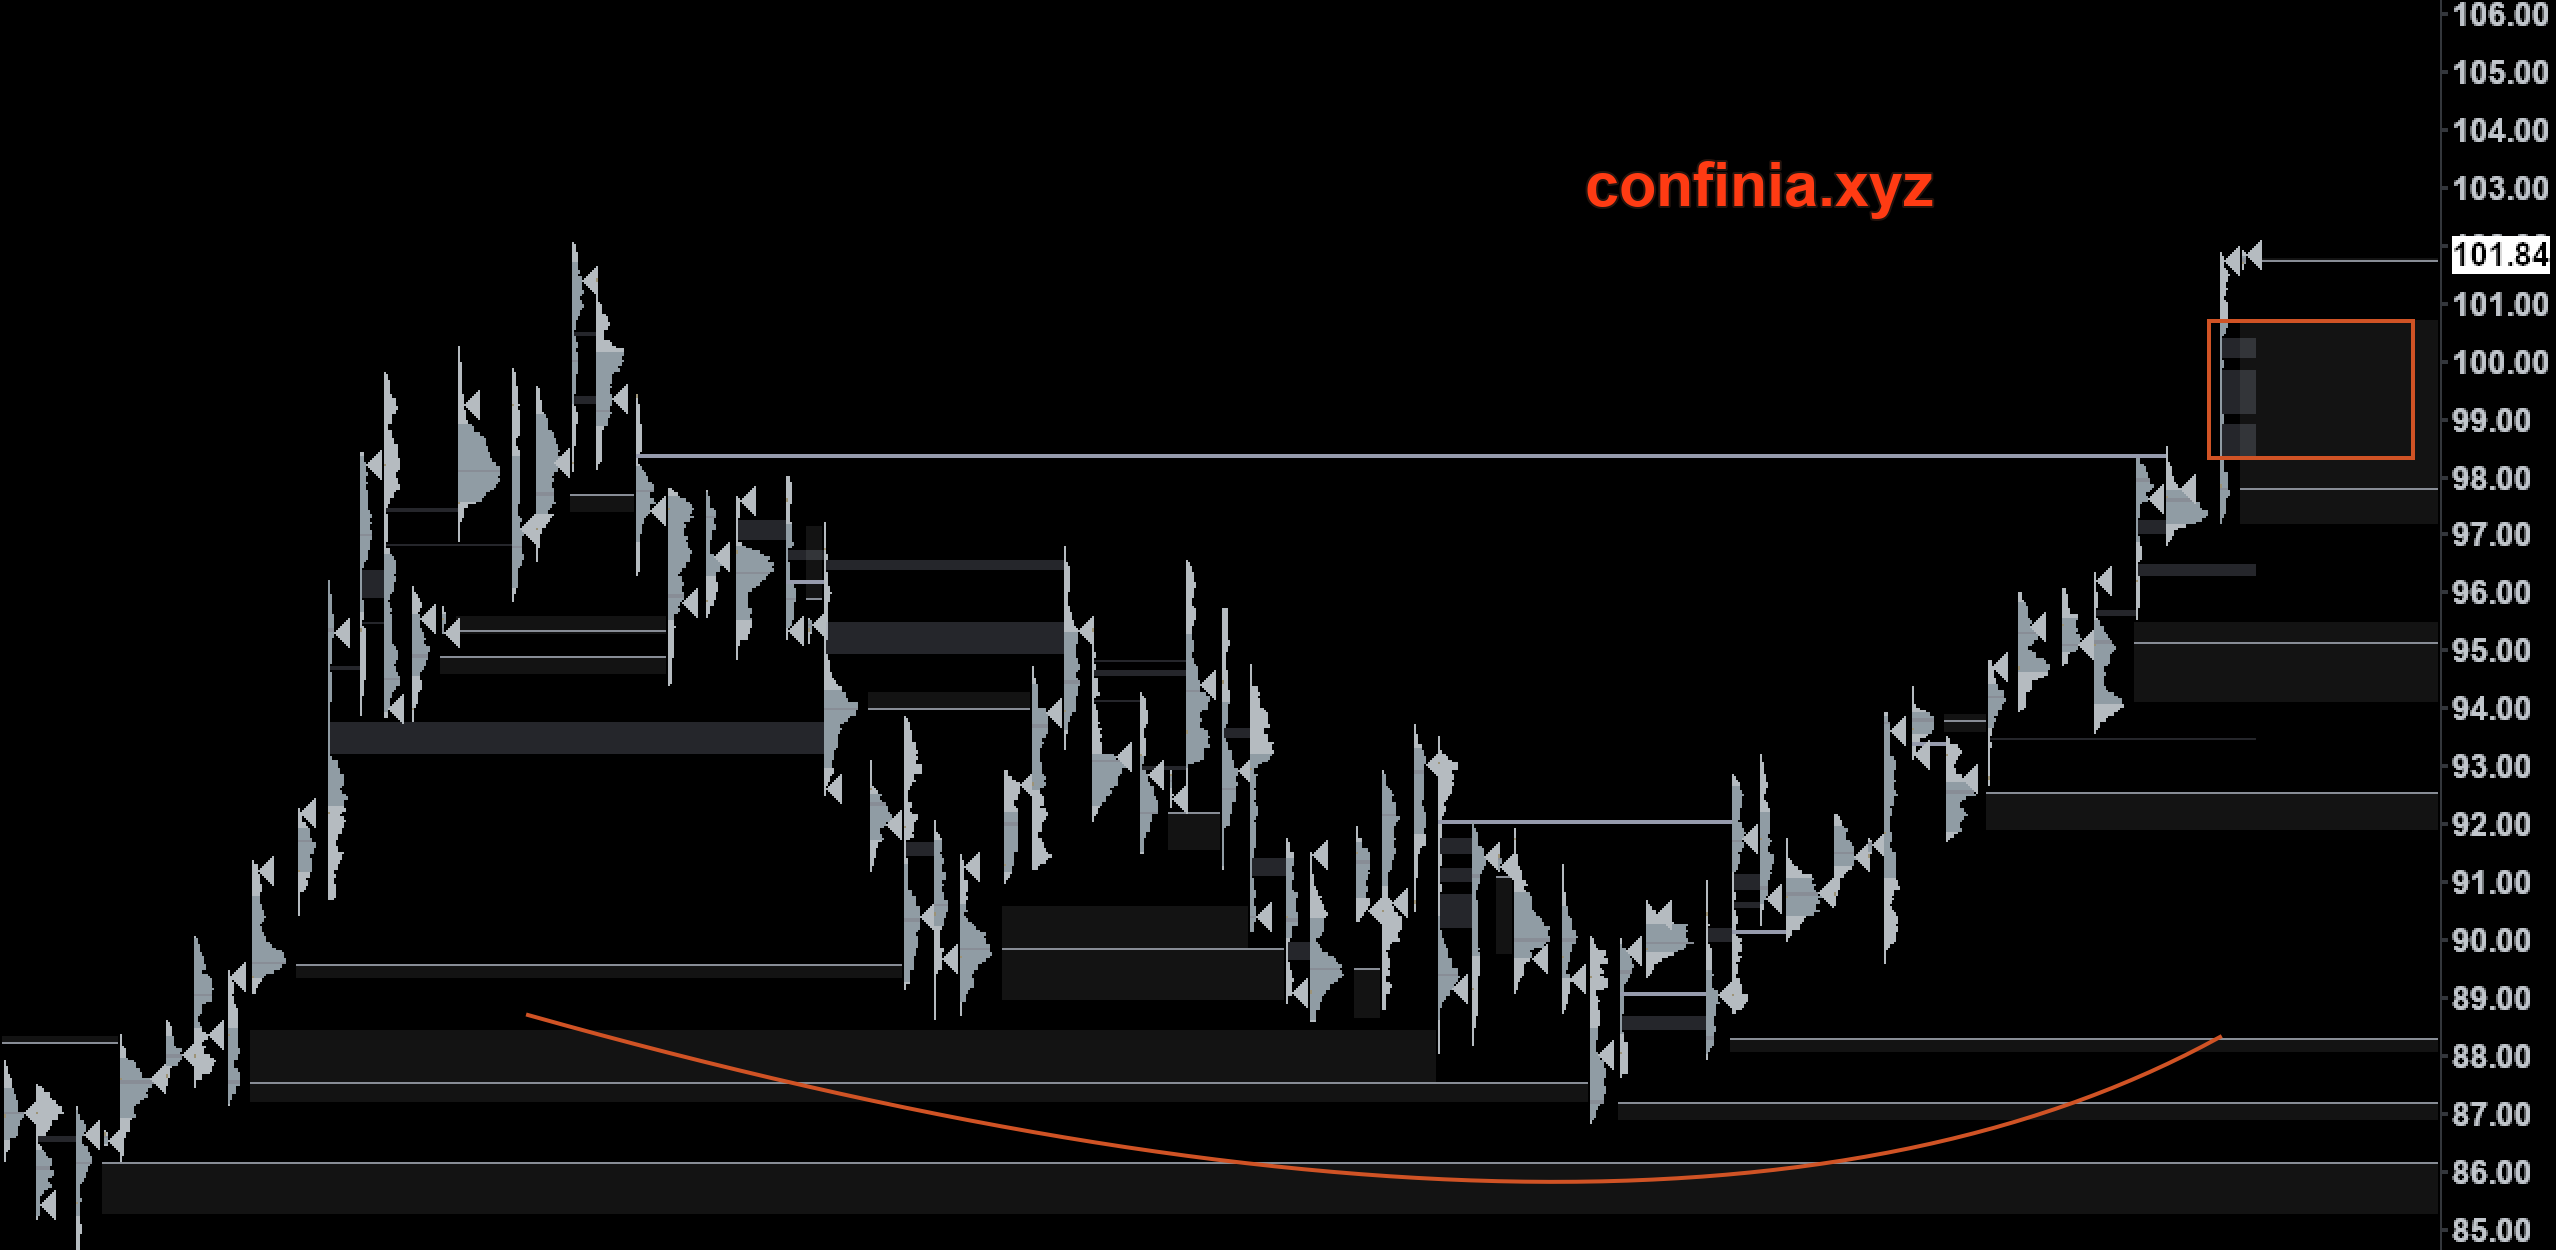 Session TPO through 16 October. Marked upside references have been cleared, with the lower base intact.
A pullback into that fast advance could offer a better entry without damaging the broader structure. Sustained acceptance back inside yearly value would weaken the bullish reading considerably.
The 30-minute chart confirms the trend shift: the early-October low was followed by higher lows, improving trend alignment and Friday’s expansion. I want subsequent pullbacks to preserve that sequence as price approaches the highs.
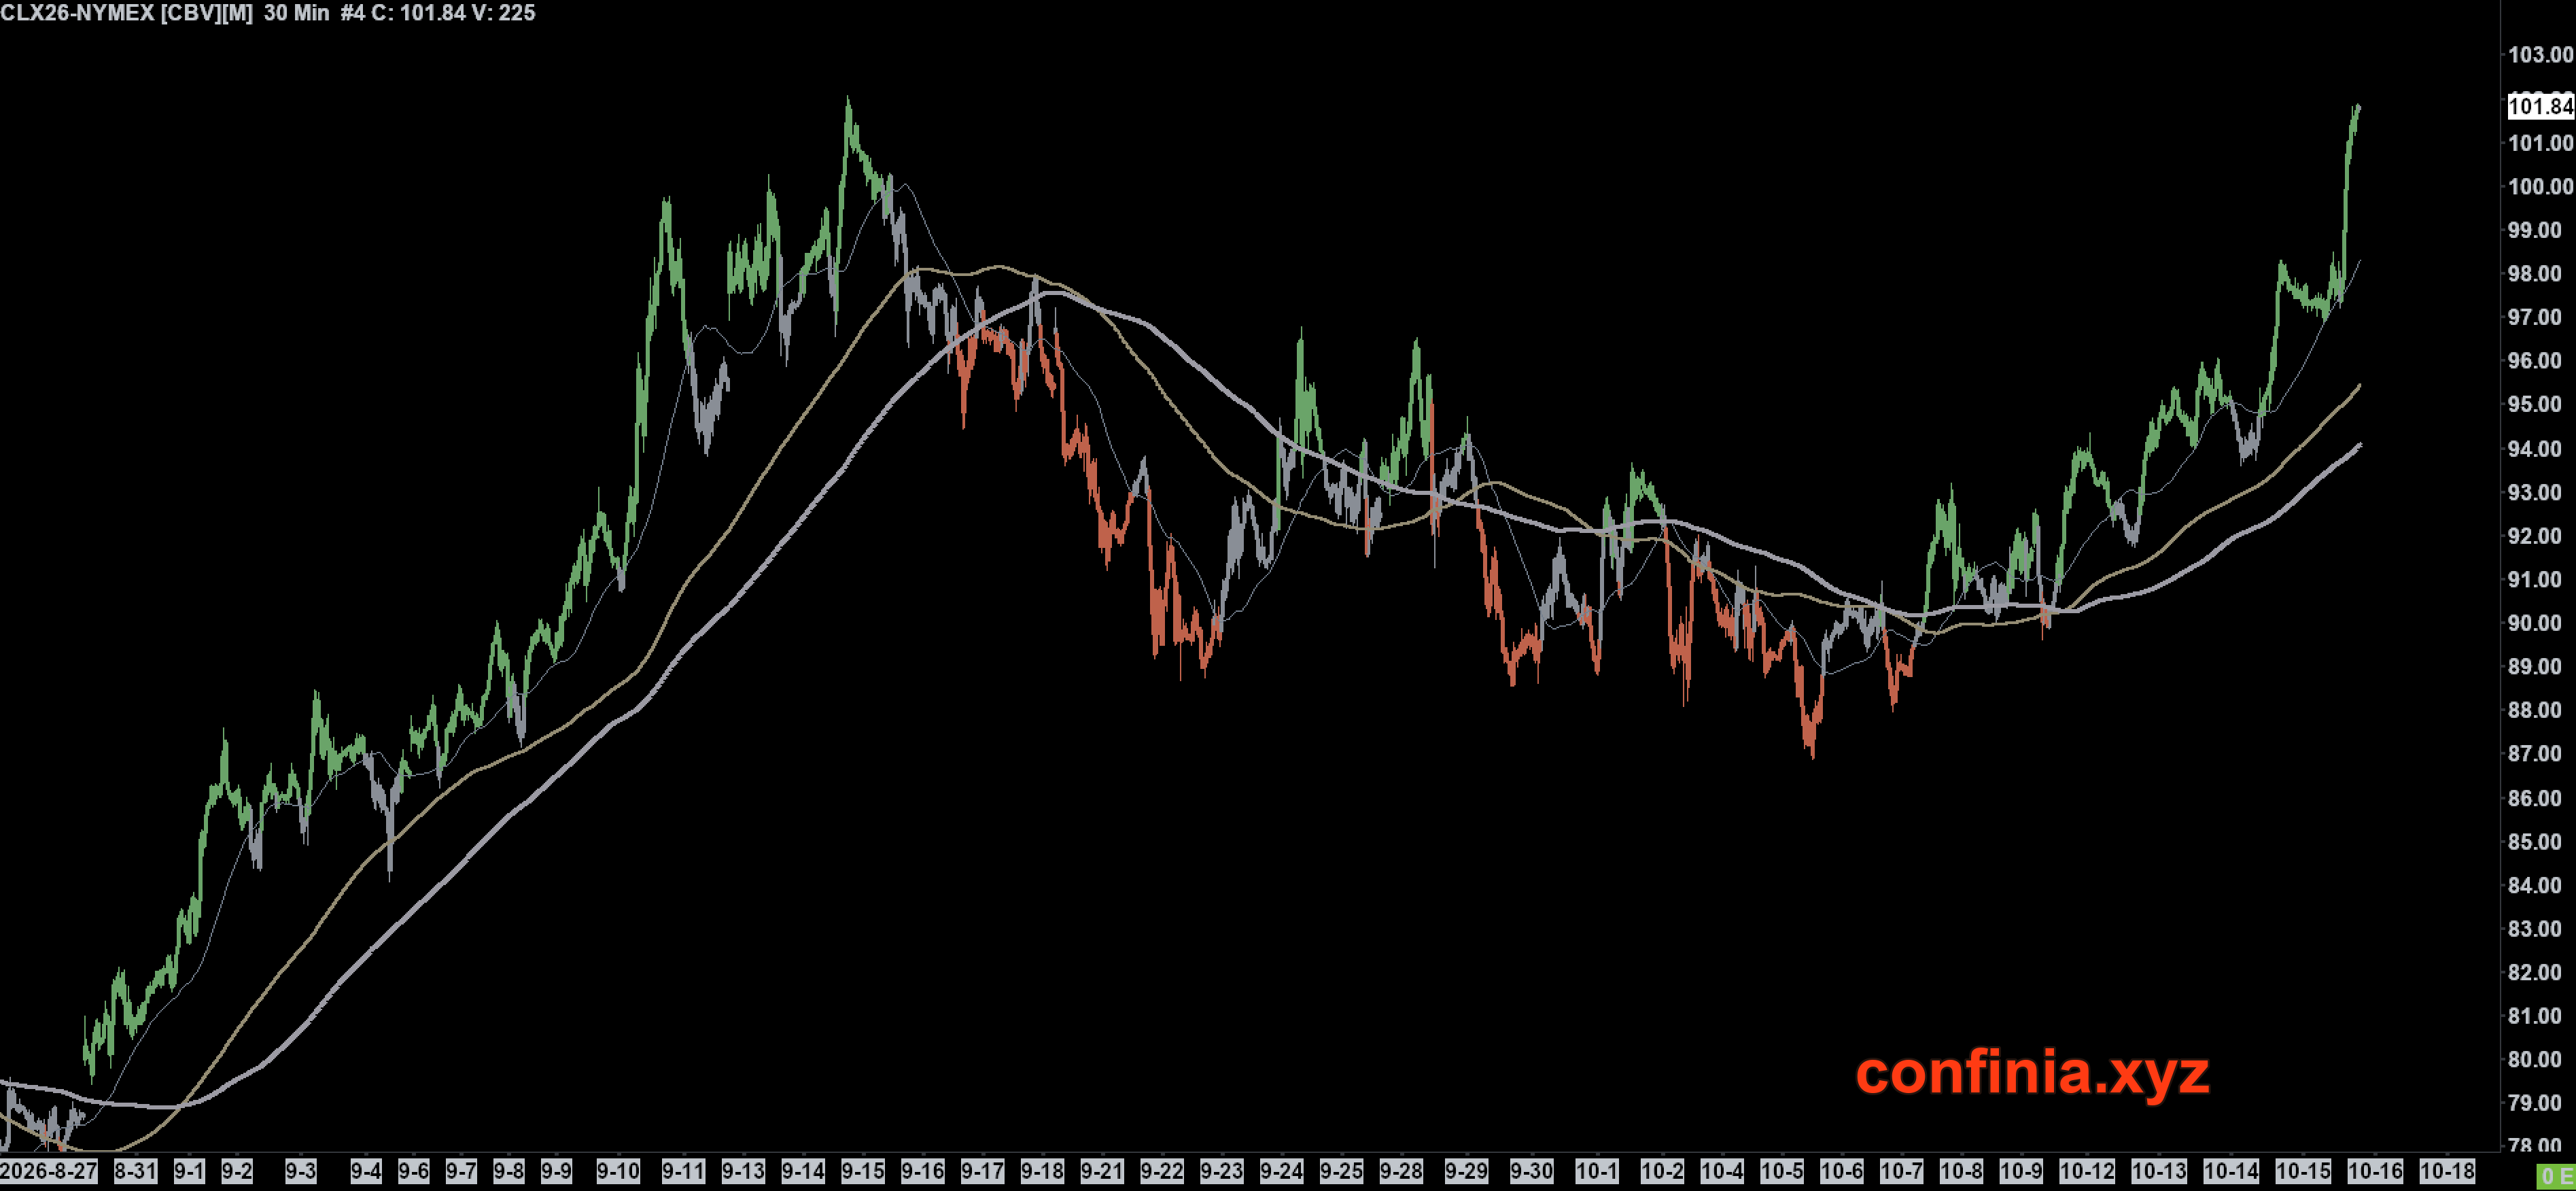 CLX26, 30-minute chart through 16 October. Displayed last price: $101.84. Spread calculations use the 16 October closing quote of $101.41.
The coming week
I’m looking for another long entry while the base holds and prompt spreads remain firm. The physical support is depleted inventories and unreliable deliveries; the price structure gives me a way to judge whether buyers continue to act on it.
Sustained stock rebuilding, easing backwardation and improved passage would weaken that view. For now, the available evidence favours another test of the highs before a durable return to normalization.
When I find a good entry, I’ll share the trade on X.
-
IEA Oil Market Report, October 2026, published 14 October. ↩︎ ↩︎ ↩︎
-
EIA Short-Term Energy Outlook, October 2026. ↩︎
-
Reuters, 16 October: oil, supply risks and reserve releases. ↩︎ ↩︎ ↩︎
-
UKMTO overview, 16 October 2026, pp. 3 and 7; incidents dated 9–13 October. ↩︎
-
JMIC Update 105, 15 October, pp. 2–3 and 7 (draft-marked bulletin). Optical comparison: Copernicus Sentinel-2, 9 and 14 October. ↩︎
-
Copernicus Sentinel-2 imagery, 5, 10 and 15 October 2026. My counts cover hulls alongside Yanbu’s crude jetties, excluding product berths. Terminal layout: Aramco ports and terminals manual. ↩︎ ↩︎
-
EIA Weekly Petroleum Status Report, week ending 9 October 2026. ↩︎
-
NYMEX futures: WTI crude oil and NY Harbor ULSD. My calculations use 16 October closing quotes: November/December 2026 and June 2027 WTI; November 2026 ULSD. The fuel spread converts ULSD to dollars per barrel before subtracting WTI. ↩︎ ↩︎
-
CFTC Disaggregated Futures-Only report, WTI positions as of 13 October 2026. Net length is longs minus shorts; percentile measured against weekly observations since January 2016. ↩︎
-
BLS September CPI release. Monthly rates are seasonally adjusted; annual rates are unadjusted. ↩︎
Send any thoughts and questions to desk@confinia.xyz.