
Bull or Bear?
Is Bitcoin beginning an independent, institutionally and policy-driven expansion—or is it merely front-running temporary relief in long-end yields that the underlying fiscal and inflation regime cannot sustain, just as it runs into major higher-timeframe trend resistance?
Review
Let’s begin where the last issue ended.
My first two issues centered on two Bitcoin ideas: risk-on conditions in the first and, more importantly, volatility expansion in the second.1 Both were released around $64k.
My second issue also described implied volatility as historically low and, in my view, cheap. The broader long-vol thesis aged well: DVOL rose from roughly 34.4 on August 9 to an intraday high of 47.1 on August 21, while realized volatility through August 25 annualized at roughly 53.5%. More importantly, the compression preceded precisely the aggressive directional expansion anticipated: Bitcoin moved from an August 9 close of $64,849 to an August 25 high of $81,265, a 25.3% move.1
Along the way, Bitcoin not only cleanly respected the levels provided—producing an immediate 4.4% retrace from precisely the initial resistance level—but subsequently, while respecting the same levels, reclaimed monthly VWAP. Confluent with the composite POC, it tapped that level again, verified the reclaim and took off from there.
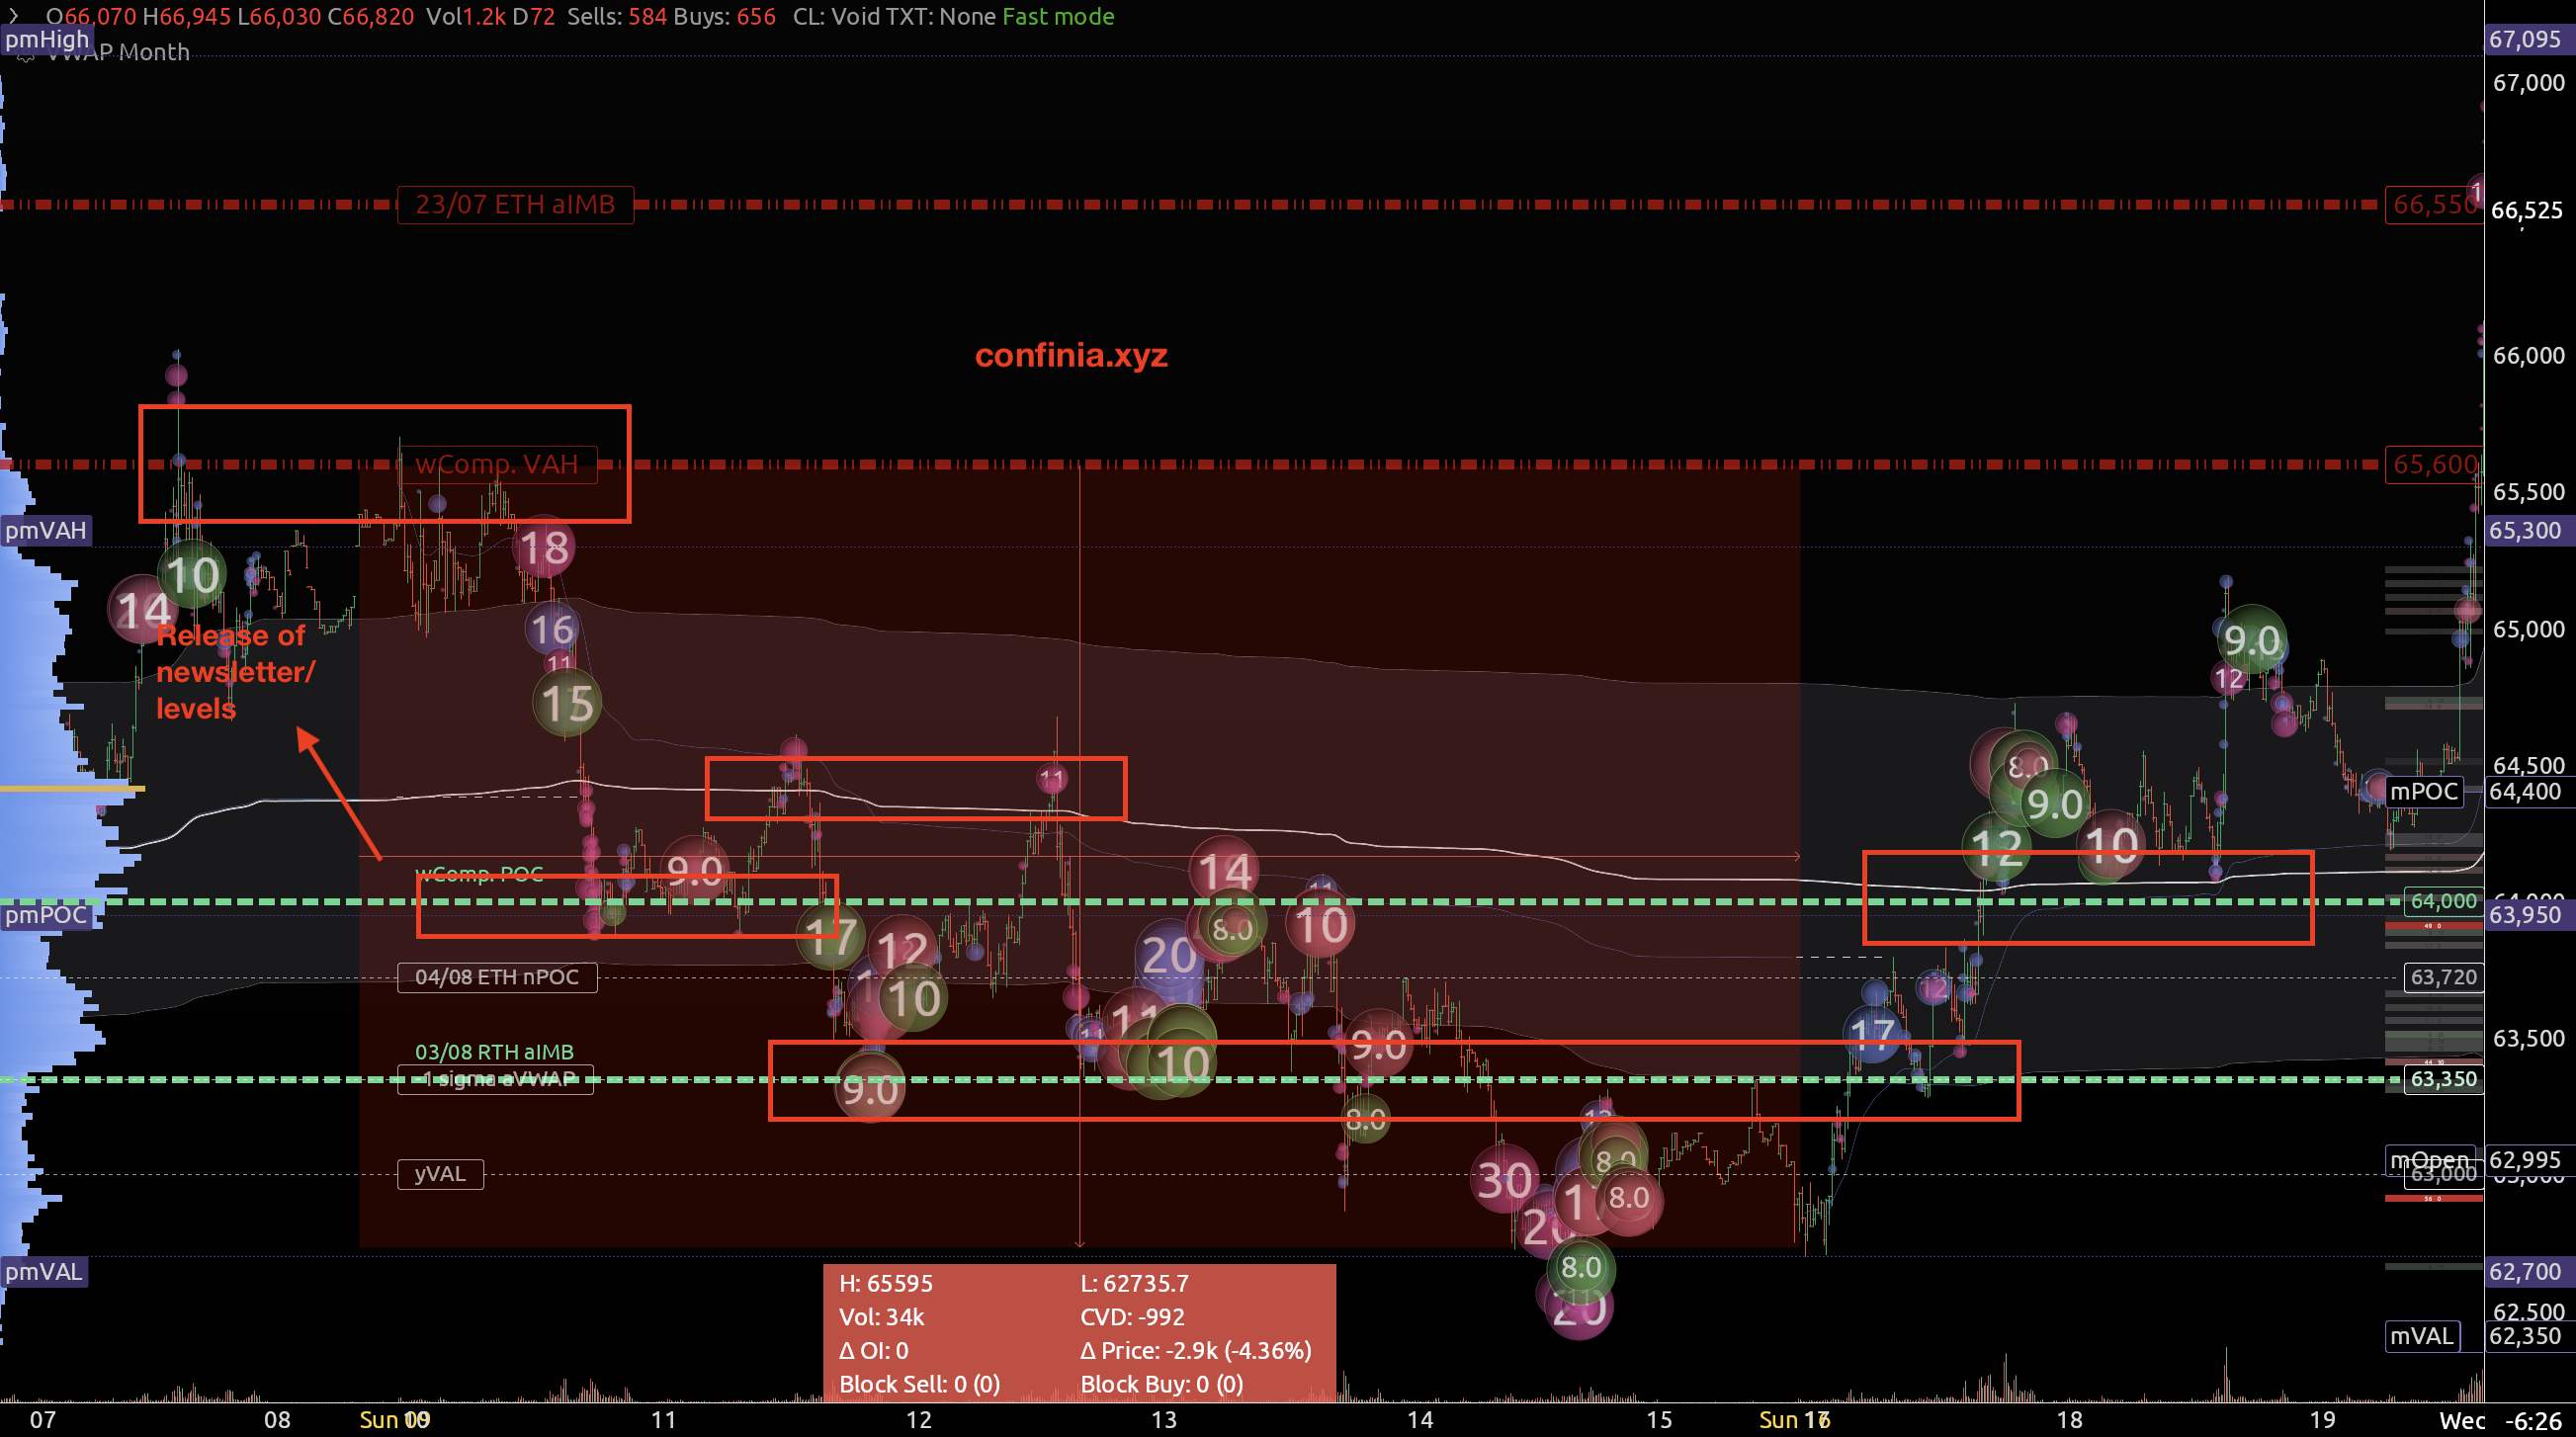 Bitcoin response around the levels provided in the prior issues.
If you read the prior issues, you had the breakout setup and the levels needed to verify direction, with the preceding 4.4% downside move mapped as well.
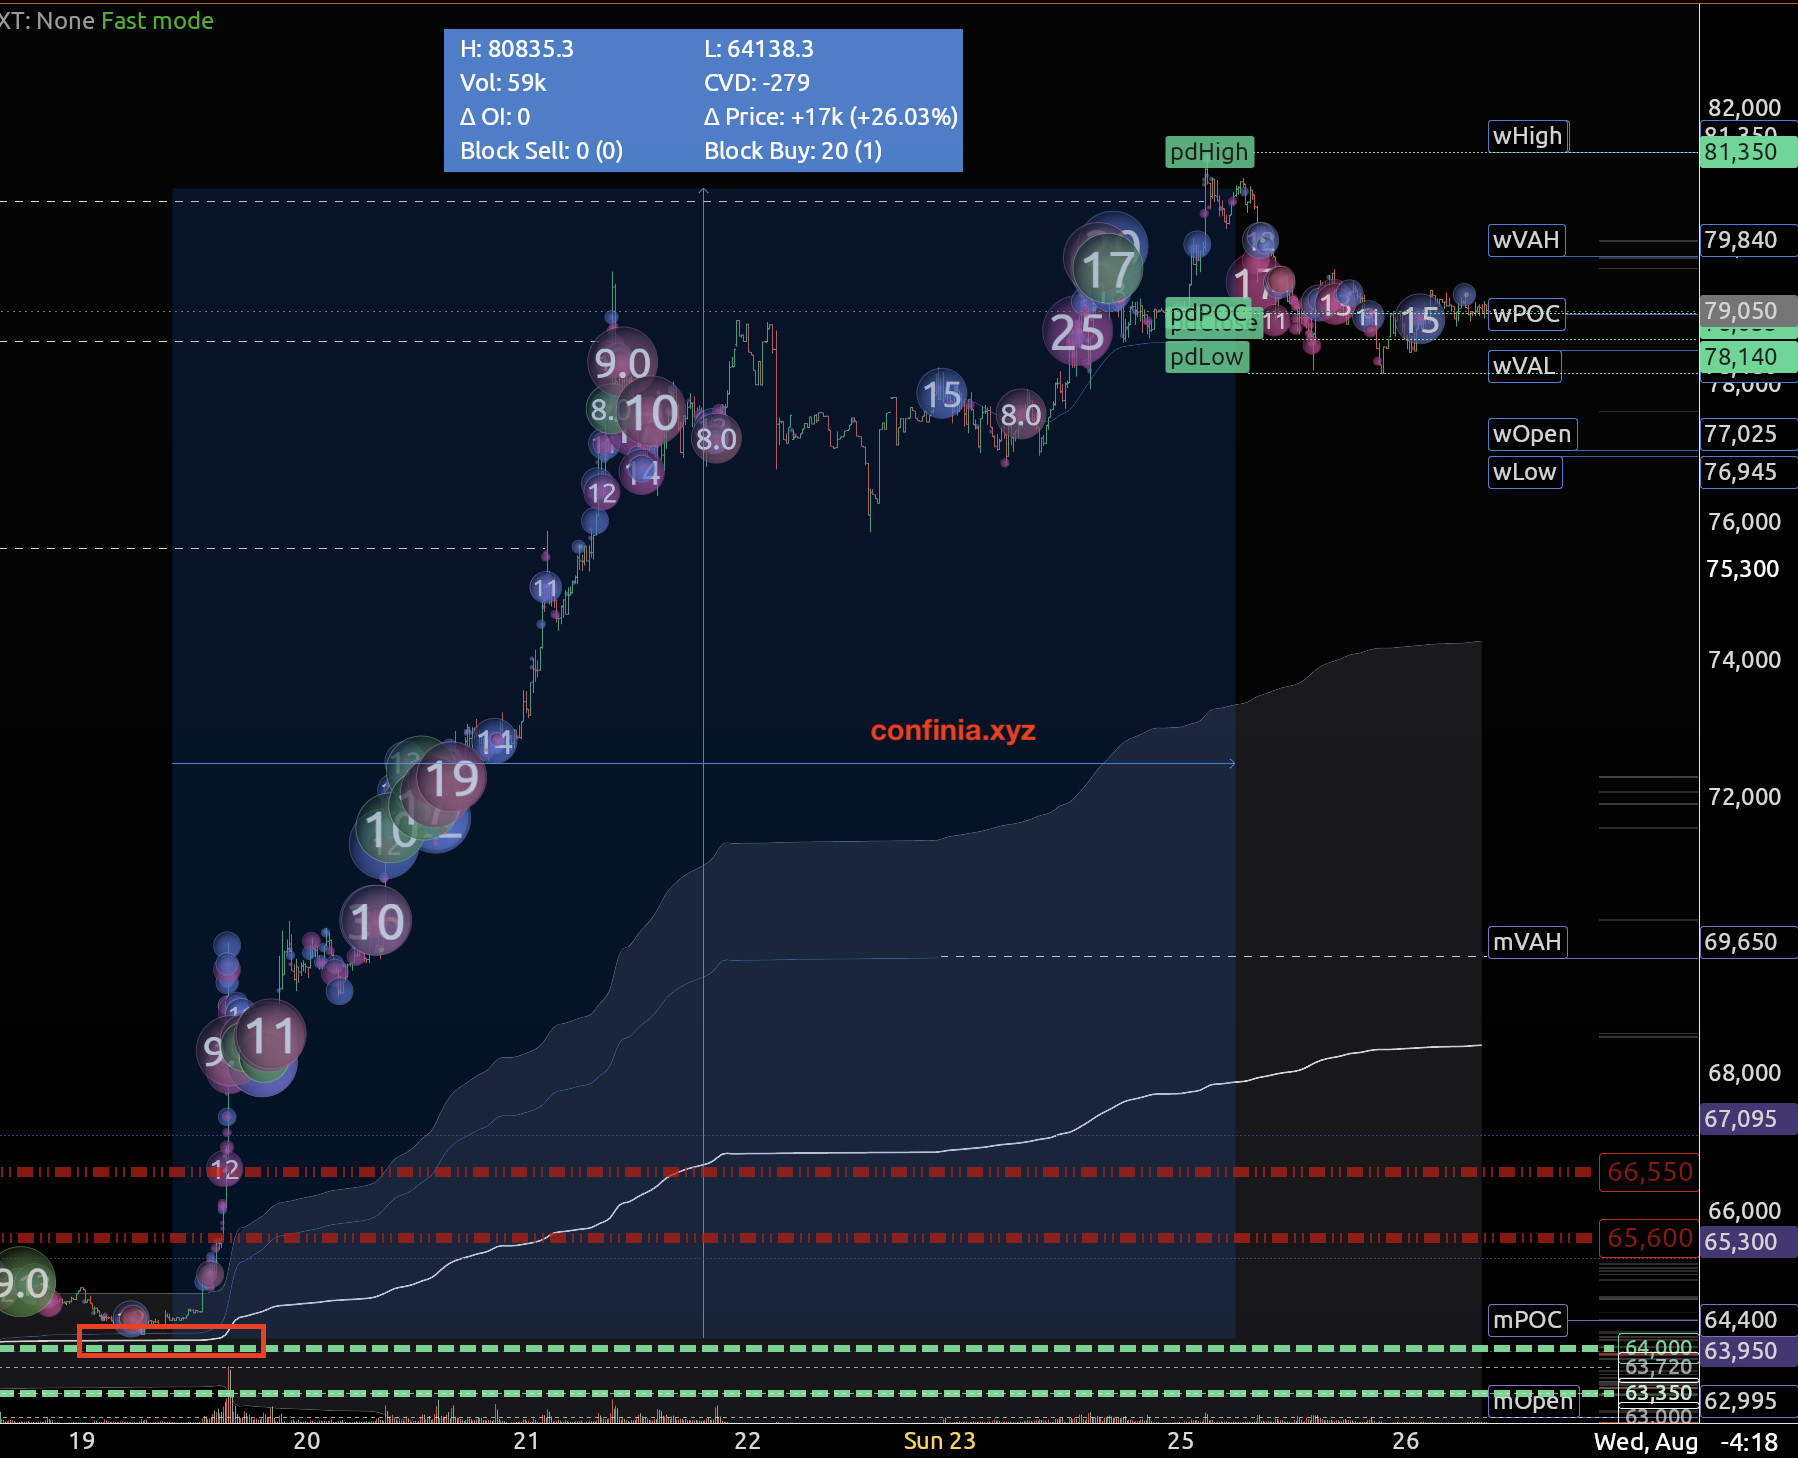 Bitcoin expansion from the prior setup.
Though this issue will not focus on oil, I’d like to point out how precisely the shared levels played out in that asset, culminating in a roughly 9% reaction from the most relevant resistance level this week.
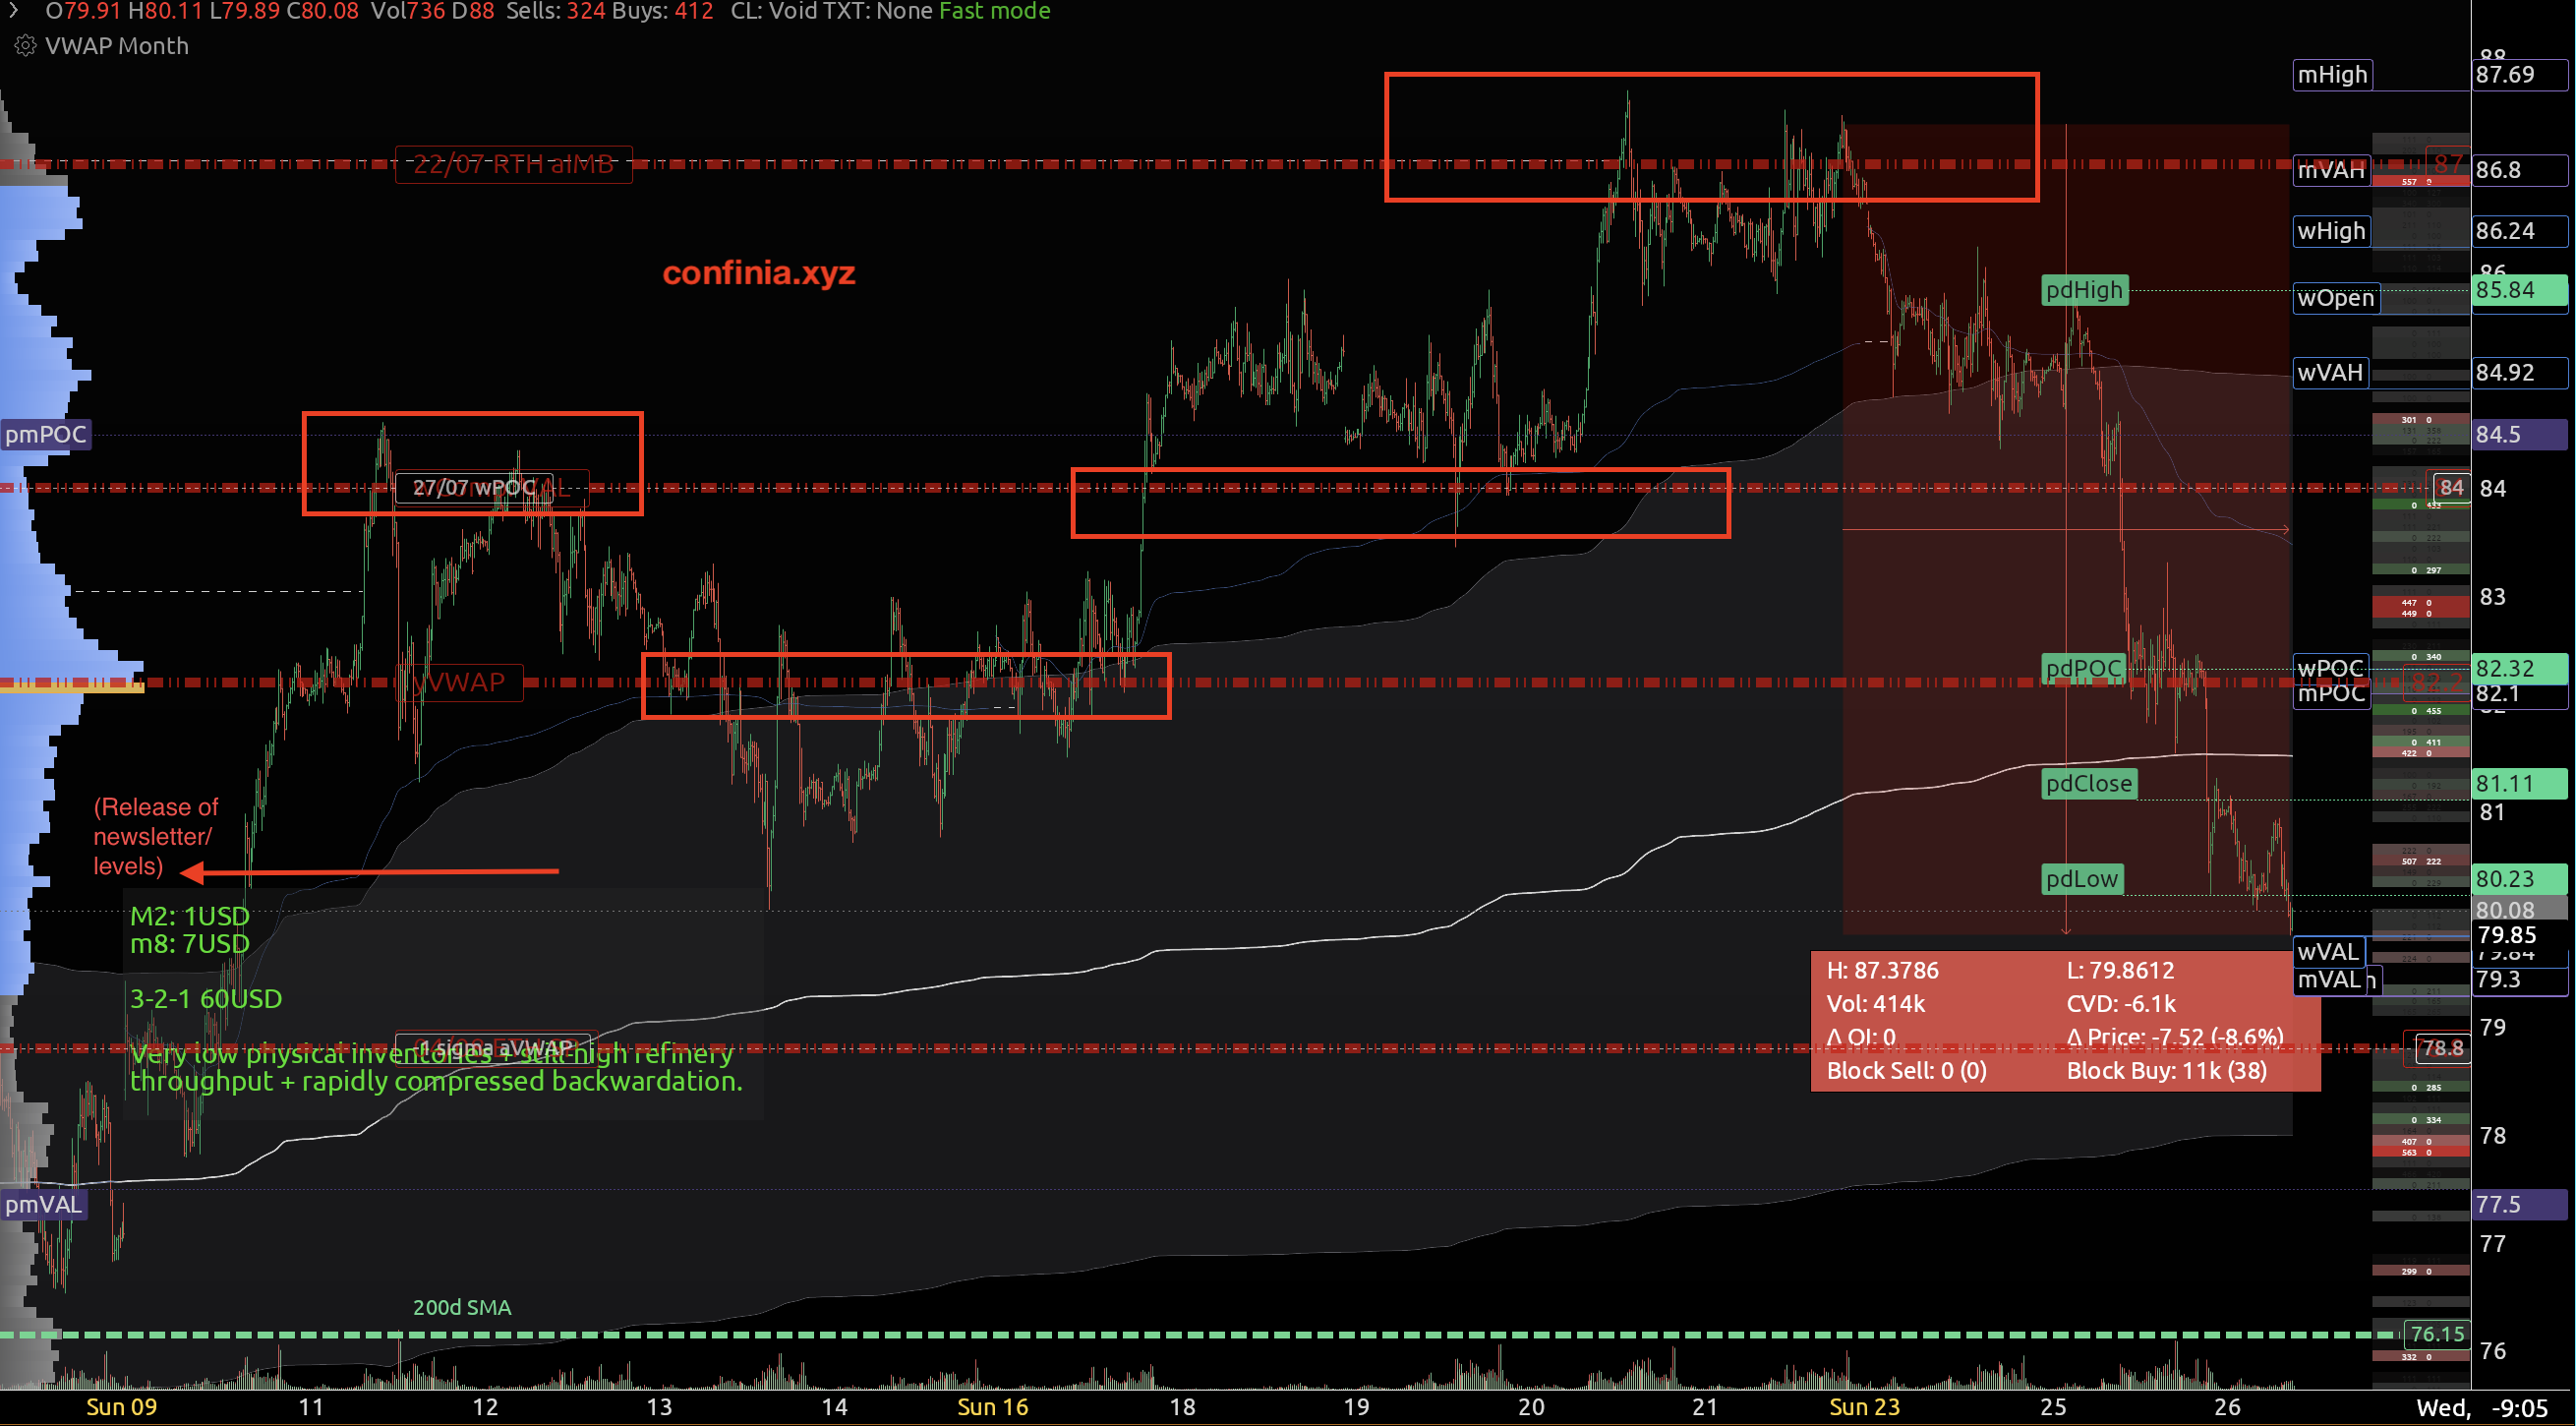 CME CL reaction from the shared resistance level.
Policy and Flows
Let’s now take a closer look at Bitcoin, its supposed catalyst, the rally’s sustainability and where it may go from here.
On August 19, Treasury announced that, beginning September 9, it will at least double the maximum size of liquidity-support buybacks in the 10–20-year and 20–30-year nominal sectors from $2 billion to $4 billion per operation. The measure lasts through the November 4 Quarterly Refunding, when Treasury will provide further guidance.2
Calling this “Treasury QE” is misleading. Treasury is buying and retiring selected off-the-run securities to support market liquidity, but it is not creating central-bank reserves or changing the government’s underlying financing need; the purchases remain part of Treasury’s broader issuance and cash-management program.3
It is nevertheless a meaningful policy signal: Treasury is showing greater sensitivity to long-end liquidity and market functioning. I treat long-duration real yields as one of Bitcoin’s clearest external constraints. Treasury-market instability can trigger leveraged deleveraging and broader financial tightening.3 Any perceived official sensitivity to long yields therefore reduces the probability that an uncontrolled long-end selloff will simply be allowed to compound.
But this is a tail-risk reducer, not an easing cycle.
Subsequent price action underscores the limitation. Yields eased from their immediate extremes but remain extraordinarily high:
- 10-year nominal: 4.64%, 97.7th percentile.
- 30-year nominal: 5.17%, 99.2nd percentile.
- 10-year real: 2.32%, 97.8th percentile.
- 30-year real: 2.92%, 99.0th percentile.
- 5-year real: 2.04%, 92.8th percentile.4
Separately, the policy backdrop for digital assets has become more constructive. Treasury is implementing the GENIUS Act, with the regulated payment-stablecoin framework expected to become effective on January 18, 2027. Eligible reserves are directed largely toward cash, short-dated Treasuries, Treasury repo and qualifying money-market funds. Bessent has said the roughly $300 billion stablecoin market could grow tenfold by the end of the decade, increasing demand for Treasury bills.5 This is constructive for dollar-denominated crypto infrastructure, but it should not be confused with direct demand for Bitcoin.
Together with seven consecutive sessions of positive U.S. spot-Bitcoin ETF flows through August 25—about $2.57 billion in aggregate—and an expansion not primarily driven by the perp taker flow I track, this is consistent with genuine spot-led demand.6 It is not, by itself, proof that institutional allocators are driving the move.
At the same time, this needn’t mean that the initial reaction cannot be temporarily overextended.
Bitcoin
If you follow my X, you know that I have been short from the mid-to-high 70s.7 The primary reason is that we are pushing into higher-timeframe, structural, trend-defining resistance on aggressive flows increasingly—but not yet dangerously—characterized by speculative buying. Near-dated call skew has turned clearly positive, while perp funding remains positive but not yet extreme.8
It is an asymmetric bet given where we stand, the recent expansion, near-term event risk from PCE and NVIDIA earnings on August 26, and how flows have transformed.9
With defined risk and rigid sizing, I can fully stand behind this bet. My invalidation is acceptance above yVWAP VAH and the 50-week SMA, followed by a break of the current higher-timeframe lower high.
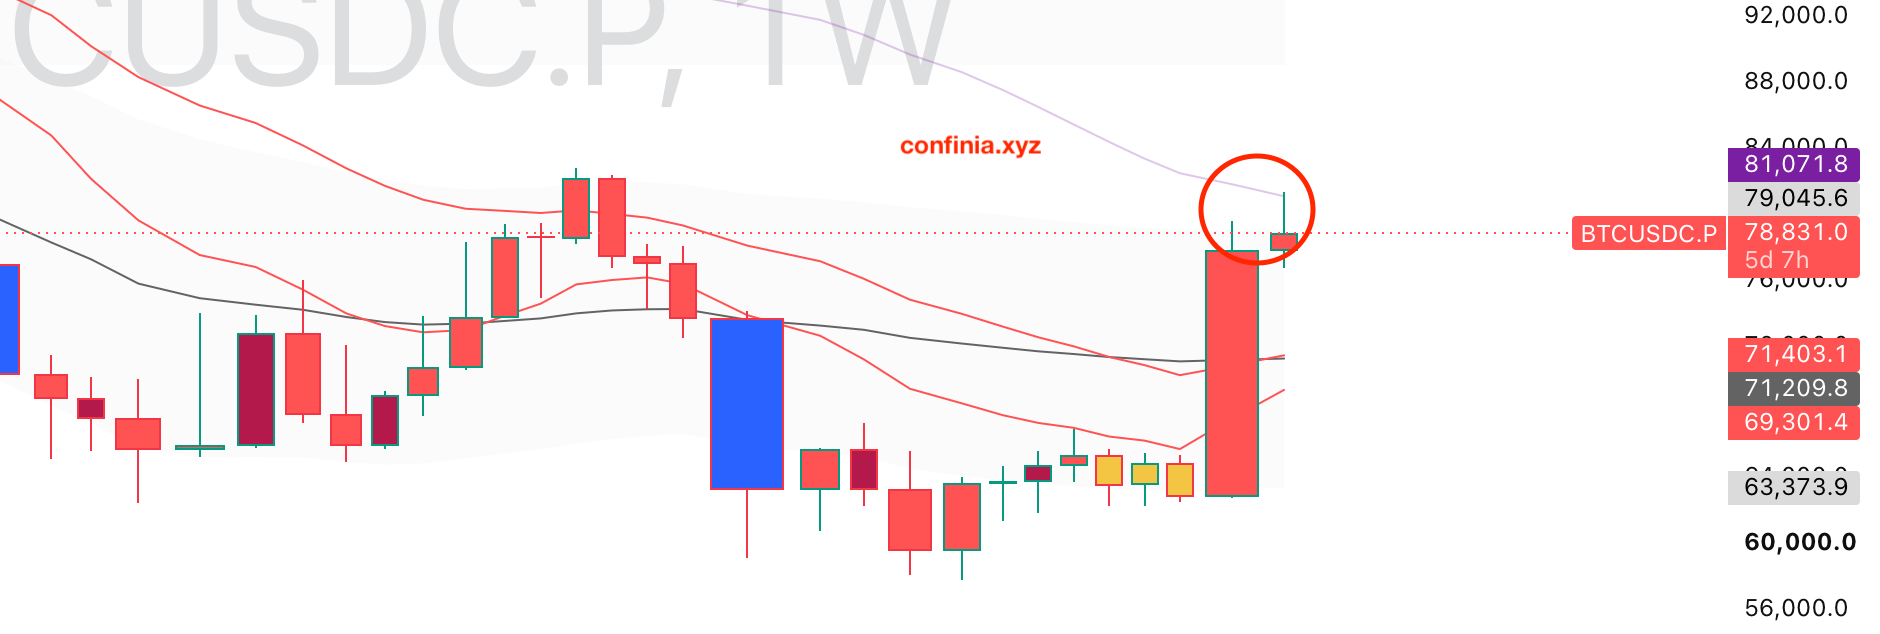 BTC weekly structure.
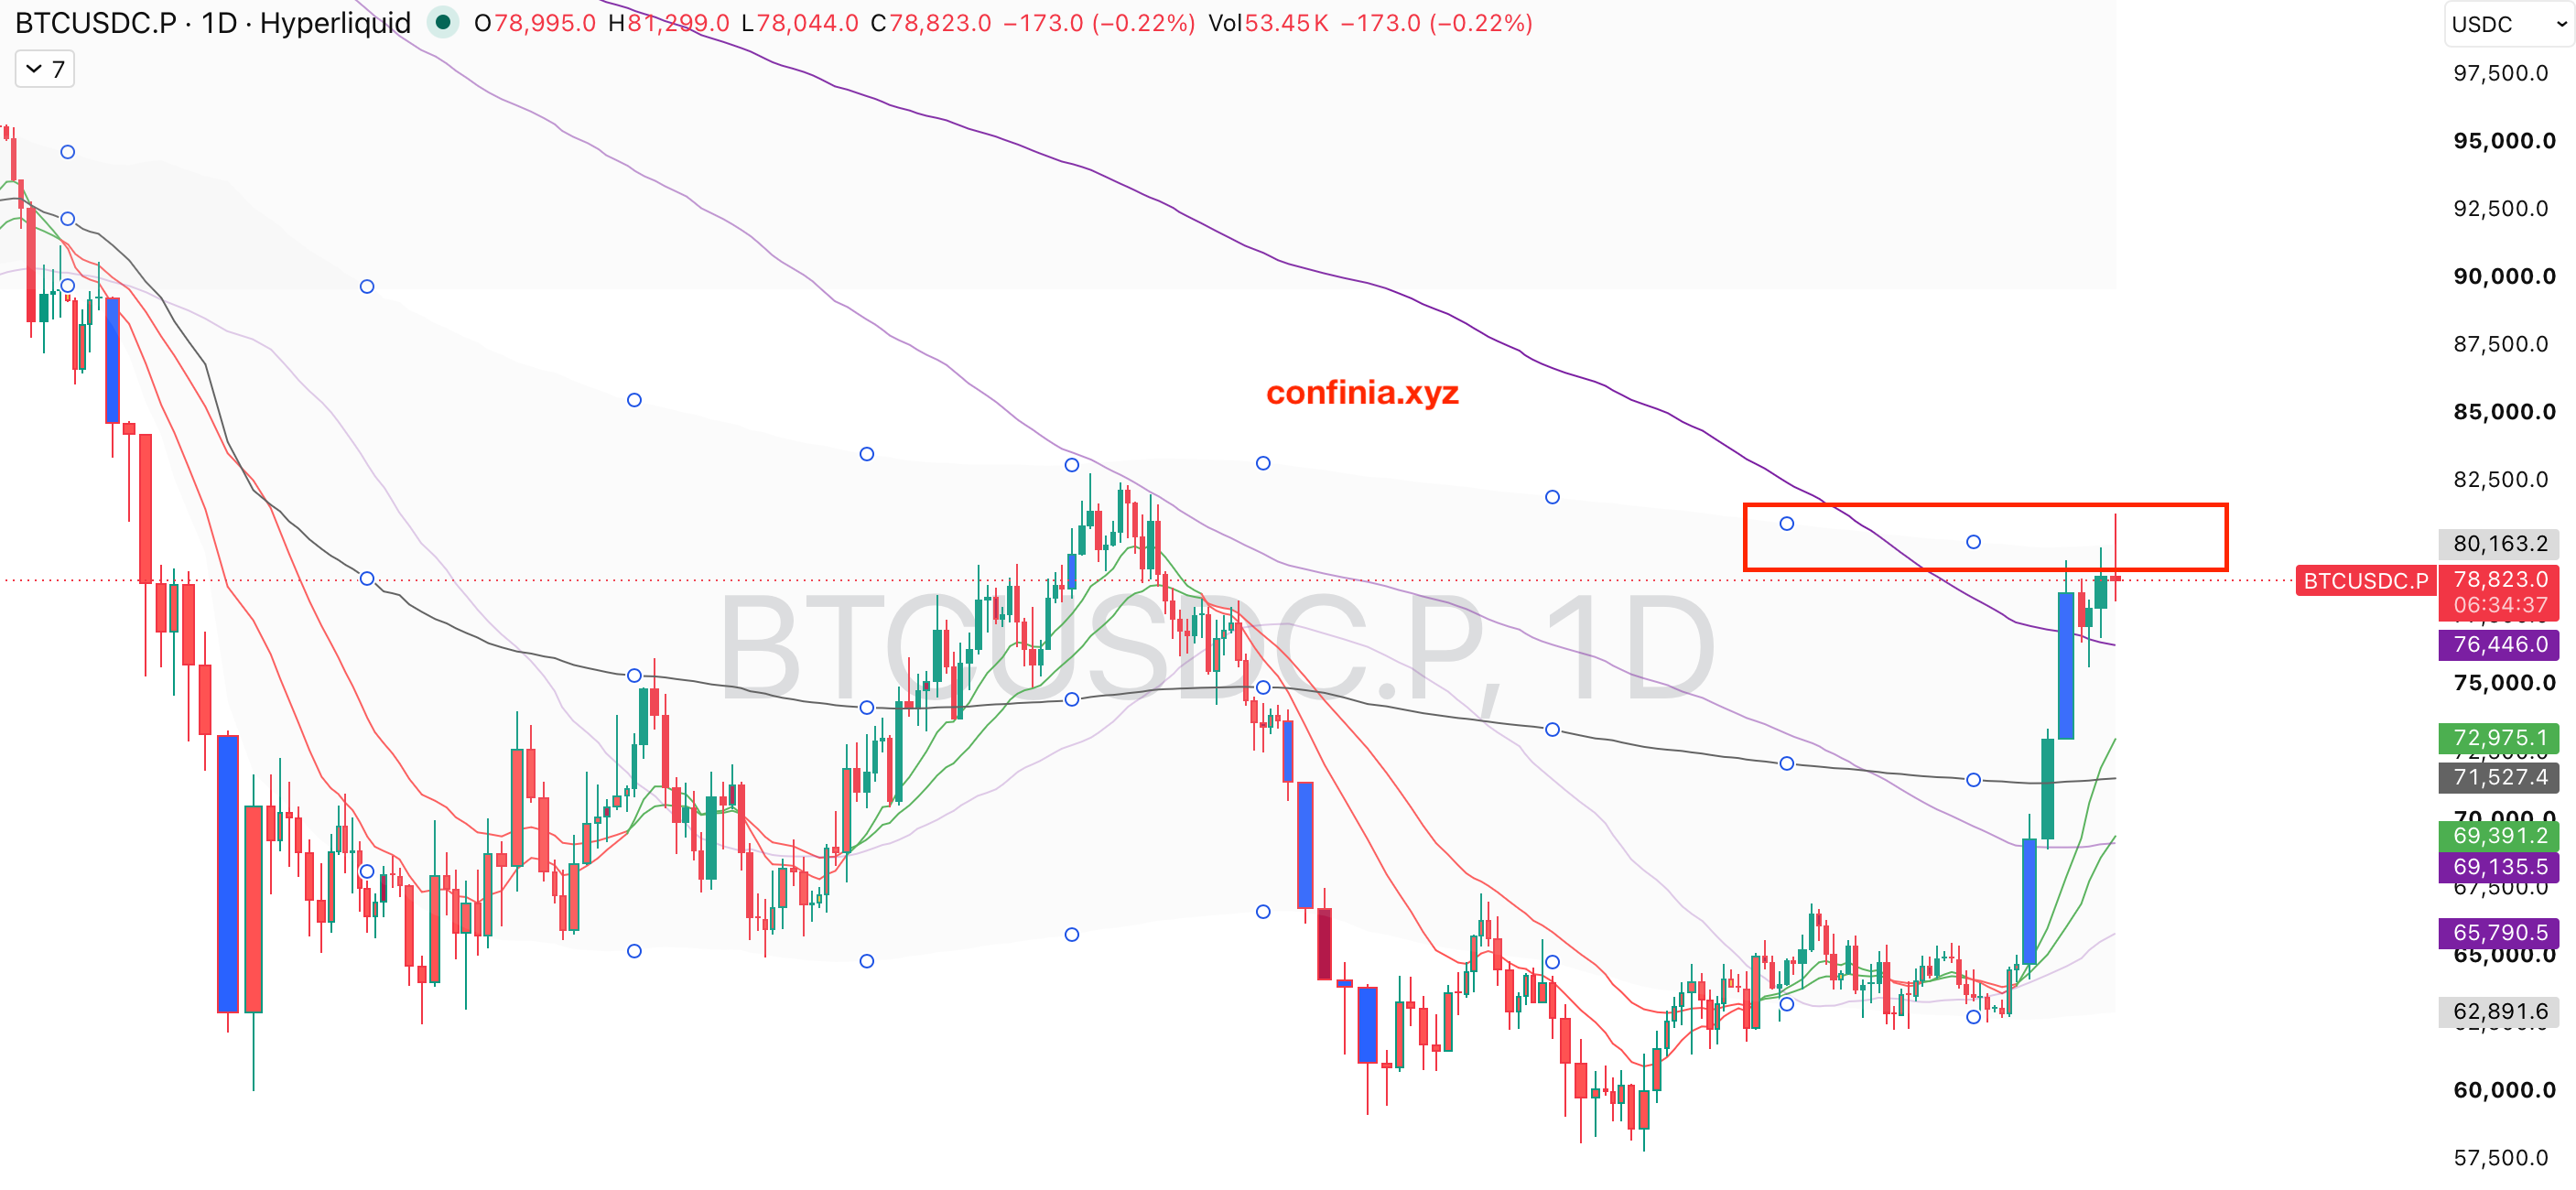 BTC daily structure.
As I revealed in my last issue, I also hold my margin collateral in spot Bitcoin, further allowing me to swiftly flip net long again if we do indeed break the trend. That would clearly put us into a higher-timeframe bull trend again. Until then, I play the trend.
On the lower timeframe, the expression of this same idea takes clean shape, too. And so do potential profit-taking levels.
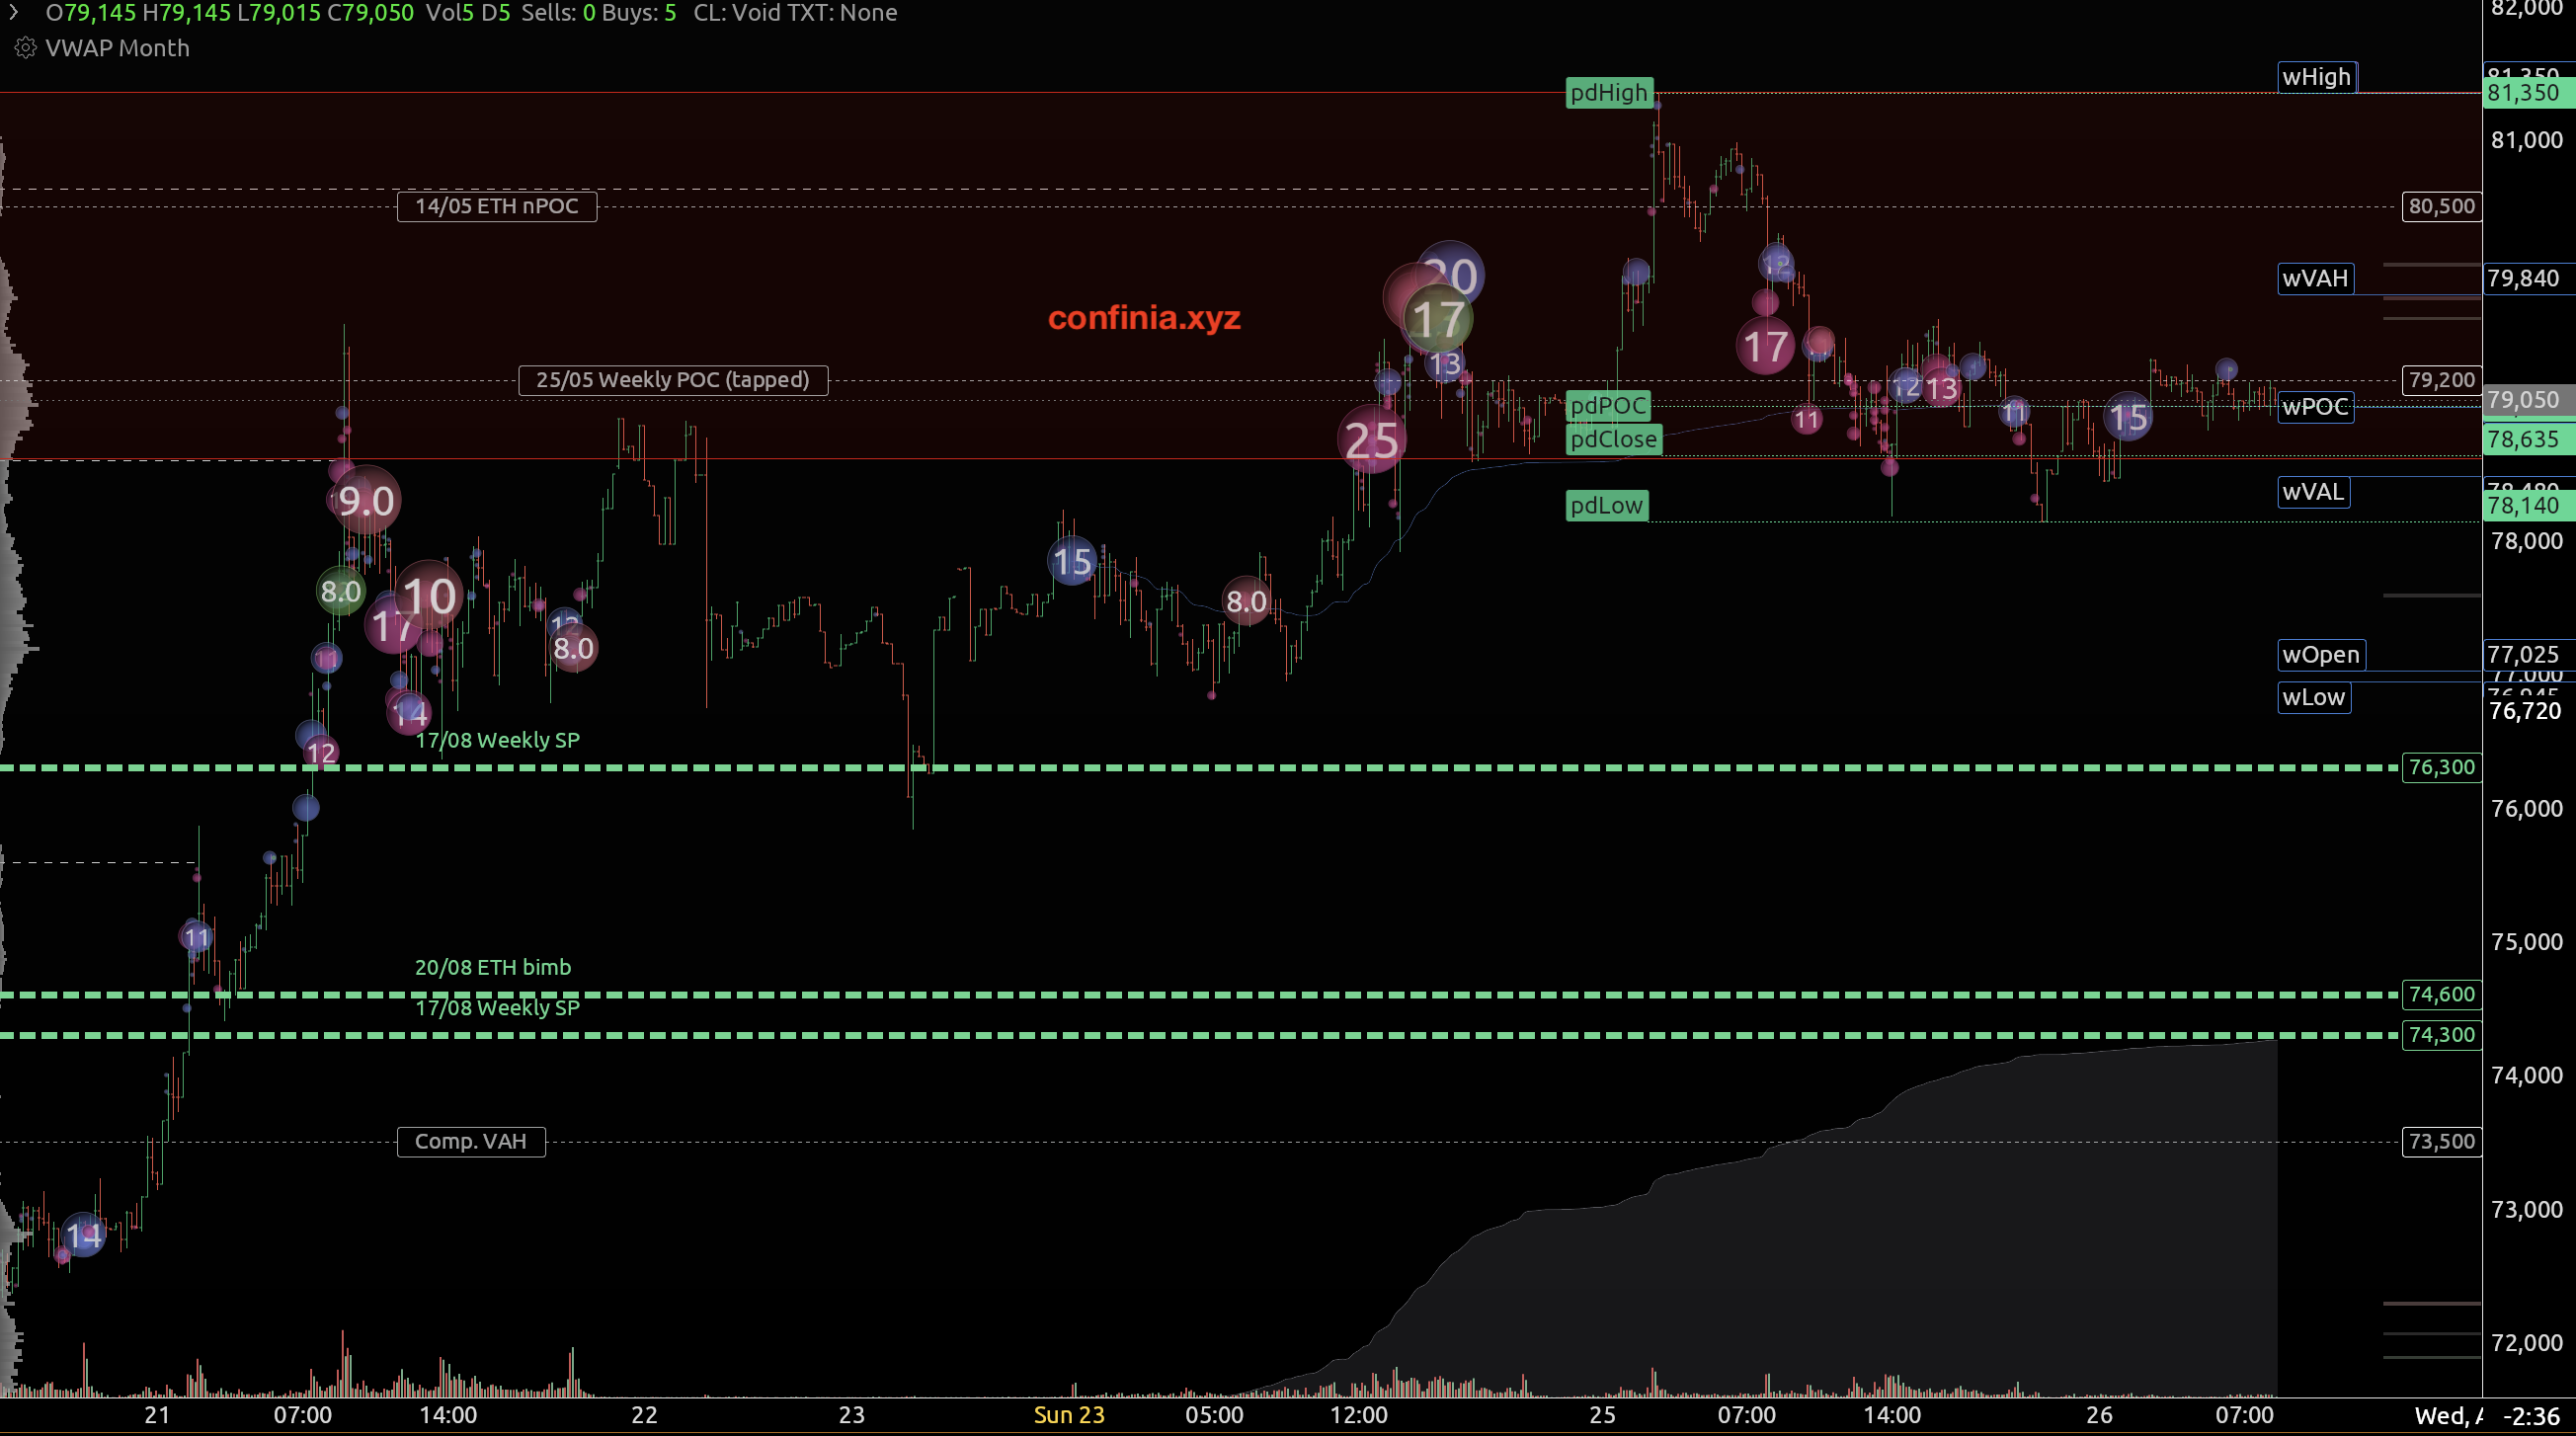 CME Bitcoin lower-timeframe structure.
I’m particularly interested around $74k and $67–71k, but will, as always, play it by reaction rather than wishful planning.
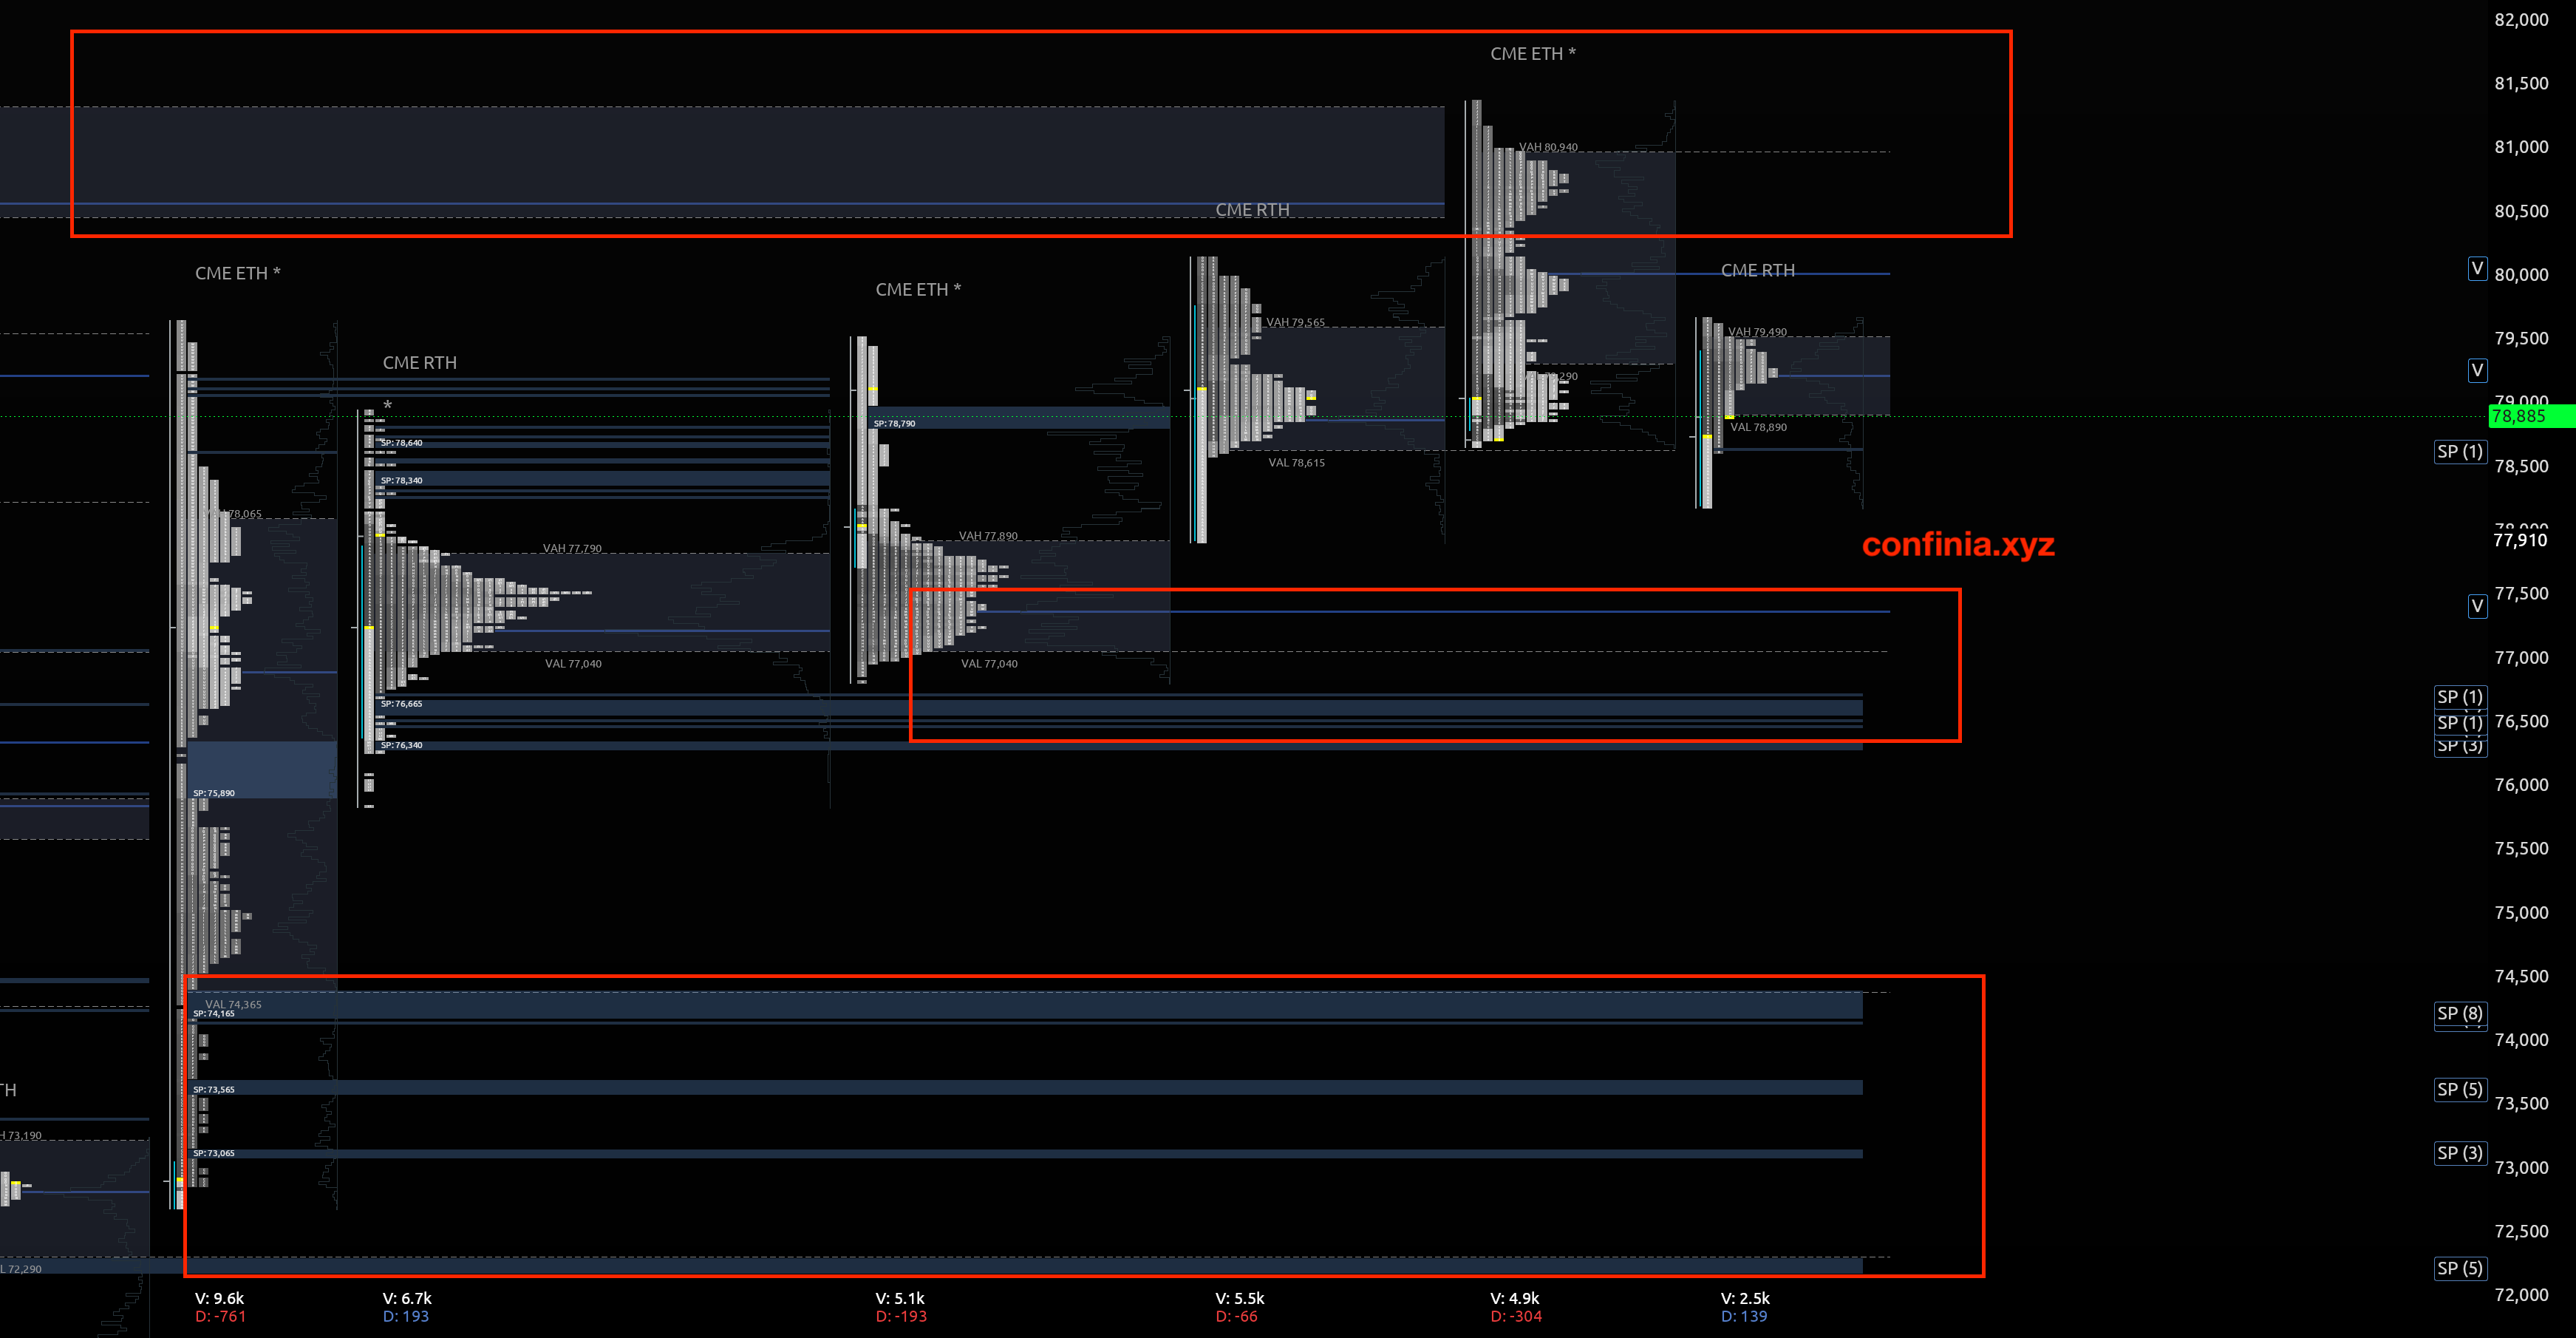 TPO view.
Other markets I’ll be watching this week are oil, gold—which is an interesting candidate for intermarket differencing approaches with Bitcoin, particularly right now—and copper, which I posted about recently.10
-
Oil Down, Risk On? and Oil Calms as Bitcoin Braces for a Large Move. Volatility data are from Deribit, and Bitcoin prices are from Coinbase Exchange. Realized volatility is the annualized sample standard deviation of daily log returns from August 10 through August 25, using a 365-day year. ↩︎ ↩︎
-
Treasury buyback FAQ, Treasury’s explanation of buyback financing and the Federal Reserve’s analysis of leveraged Treasury exposures. ↩︎ ↩︎
-
August 25, 2026 observations from Treasury’s nominal and real yield curves. Percentiles use daily observations from August 2016 through August 25, 2026. ↩︎
-
Treasury’s proposed GENIUS Act rule, Bessent’s remarks and the Treasury Borrowing Advisory Committee analysis. ↩︎
-
Publication-time snapshots from Deribit and Hyperliquid. ↩︎
Send any thoughts and questions to desk@confinia.xyz.